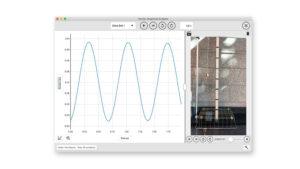
Starting the year with Vernier Graphical Analysis® in your classroom or lab? Discover helpful features you might not be using yet and see how Pro features can support deeper analysis. Vernier experts Verle Walters and Nüsret Hisim demonstrate different analysis tools—like graph matching, manual curve fitting, and interpolation—and share examples of how to use them across different science courses. Get practical tips to help students explore and interpret data more effectively.
You will learn how to
- Use graph matching, manual curve fitting, and interpolation to support science and engineering practices
- Incorporate both free and Pro tools into your existing curriculum, across grade levels
- Adapt these tools for use in biology, chemistry, physics, and other science classes
- Create and use bar graphs to present experimental data more clearly