Sharing ideas and inspiration for engagement, inclusion, and excellence in STEM
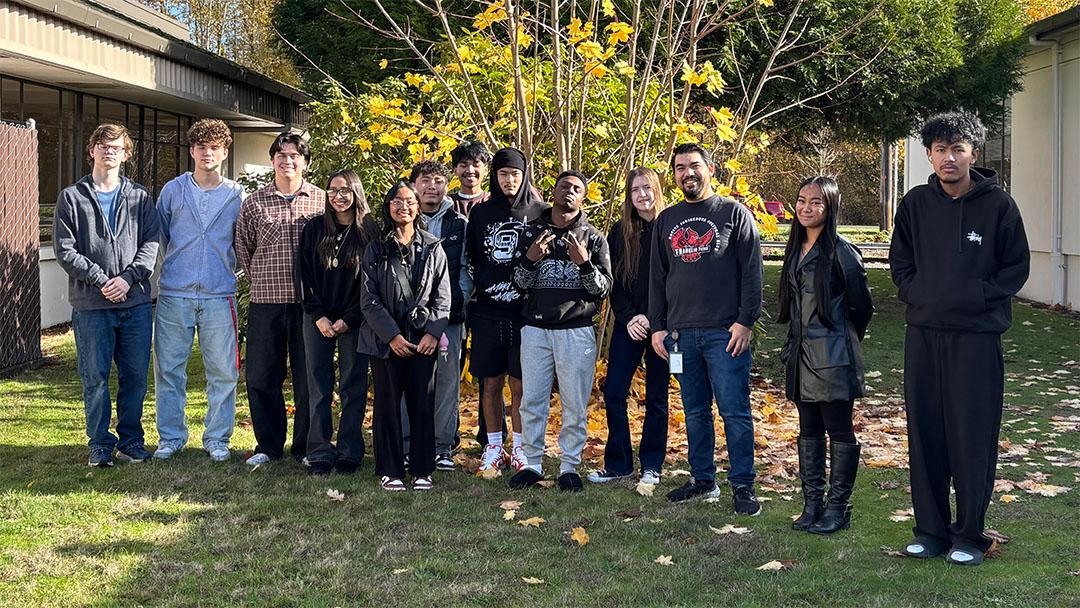
Every day, my students cross 112th Street outside our high school—a busy, four-lane corridor with a 40 mph speed limit that often feels more like 50. When I asked my class how they feel when they walk home or cross that road, most of them had similar answers.
“I’ve seen so many distracted drivers on this road, so many people speeding, even though I don’t walk on this road, it seems so unsafe for anyone who does,” said Jaxon H.
“I’ve walked home twice, and from experience, it does not feel safe. It feels dangerous walking so close to cars going 40+ mph,” said Johana S.
“I was almost run over when crossing the lights from 112th and Parkland because a driver was on his phone and ran a red light,” said Viset T.
The gist was clear: We feel really unsafe. So I said, “Okay, let’s prove it. Let’s quantify that feeling.” That’s where this project began—with students naming a real problem and deciding to test it with data.
In our first unit on one-dimensional motion, we asked a simple question together: Are cars driving faster than they should—and can we prove it with physics? And then we tied that to a slightly more complicated one: If we can prove it, how do we get policy changed?
Designing the Investigation
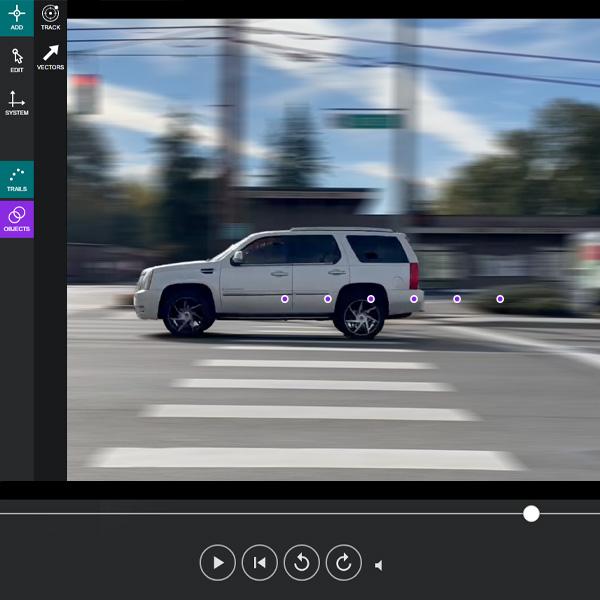
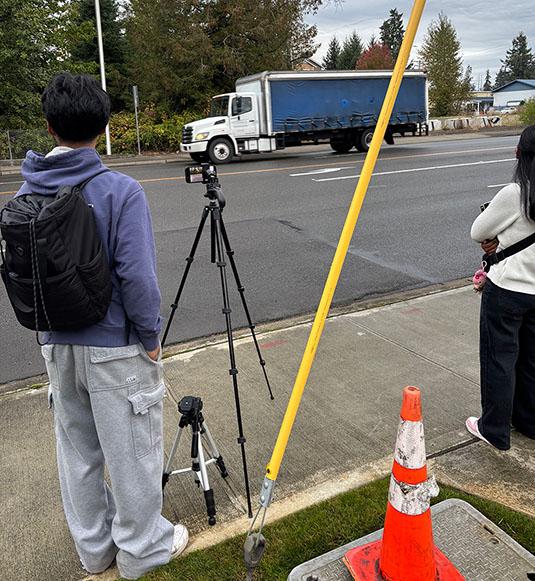
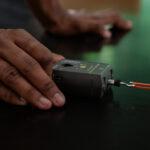
To answer that question, we needed good data. First, we designed a plan to film vehicles at three locations around the 112th Street and 18th Avenue East intersection. Then, we would analyze vehicle motion using Vernier Video Analysis®.
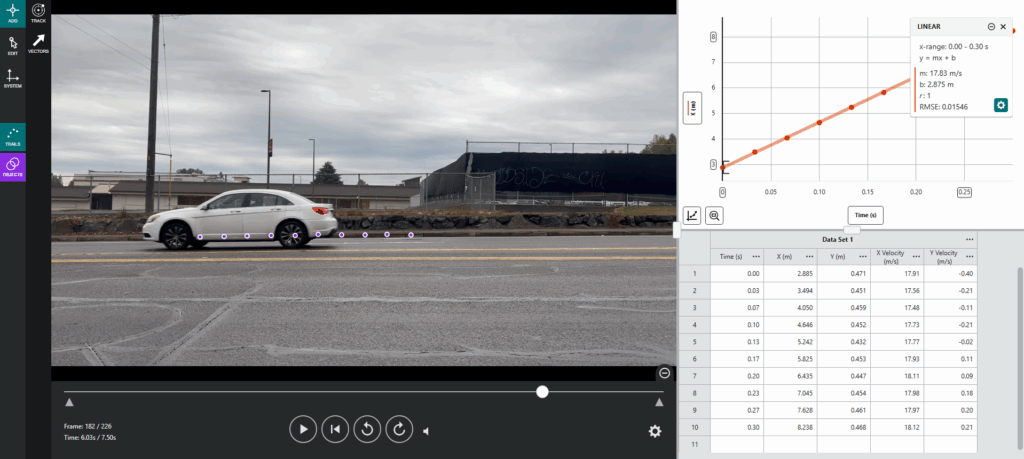
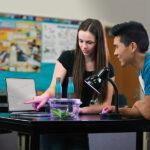
Students imported each video clip into Video Analysis, which allowed them to track a car’s motion frame by frame. By clicking on the vehicle’s position in each frame, they generated a data table and position–time graph directly from the footage.
To ensure accuracy, students first set a known distance in each frame—usually a tape-measured reference that we set up. When that wasn’t possible, they looked up the make and model of each vehicle and used its length as the reference measure. Once the scale was set, they used the software’s line-fitting tools to model the data with a linear best-fit line. The slope of that line represented velocity (v = Δx / Δt), which they converted from meters per second to miles per hour using the factor 1 m/s = 2.24 mph.
“Collecting the data was easy. Vernier Video Analysis was easy to use, and I got the hang of how to do it pretty fast,” said Olive G.
“It was pretty fun collecting data and pointing out people who were speeding,” added Gabriel S.
Since we wanted to use our results as evidence for the district and county to improve school safety, it was essential that we approached the experiment and data with fidelity: repeating trials, recalibrating when reference distances were off, and documenting assumptions. But what mattered most was the shift in student mindset—we weren’t just doing a lab, we were building evidence to address a community safety issue.
“It was a cool experience using physics to advocate for safety,” said Johana S.
As a teacher, it was powerful to see students use these tools to make numbers mean something outside of academics and in the real world. Not just typing it up in a document, but using it to try to make a change and get an outcome. It’s been rewarding to watch them take ownership, connect their personal experiences, and build a data-informed argument that matters.
What the Data Showed
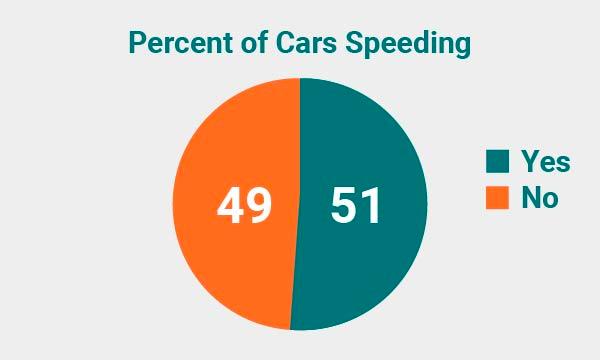
Students analyzed 100 vehicles. The average speed was 46.63 mph, 51 were above our “over-limit” threshold of 46+ mph, 17 exceeded 50 mph, 6 were over 60 mph, and the highest recorded speed was 70 mph. On a corridor with a posted speed of 40 mph, those numbers tell a clear story about risk for pedestrians during school hours.
“My personal experience of collecting data and analyzing was fun, but also a terrifying experience because there were many people driving on their phones and speeding,” said Viset T.
Students also mapped the context. Eastbound traffic past our school tennis courts funnels into a narrower, downhill section with no shoulder—exactly where the fastest speeds were observed. That physical setup, coupled with missing or inconsistent school-zone cues, increases exposure for students who walk that route. It really puts students and pedestrians at risk.
“Seeing the too narrow sidewalks, speeding cars, and lack of signage made me realize how dangerous this route is for me and other students.” said Zack E.
“This project, to me at least, is more than just a school project. It’s a culmination of feelings clashing within our student body and finally bursting out. This project feels less like busy work and more like taking real action for a real problem happening in the real world—in my community,” said Jaxon H.
From Evidence to Civic Engagement
With graphs, tables, and annotated clips in hand, students prepared a report and presentation for our district safety committee—and I began contacting county traffic officials about signage and speed monitoring. We learned quickly that 112th is a county road and that to make progress means persistence.
Learning more about how local government works also became a part of the investigation. My students researched who decides and funds signage, what state rules govern school-zone speed limits and “When Children Are Present” conditions, and which interventions (like speed radar signs) are likely to reduce median speeds on multi-lane corridors like 112th. They really dug into the full, real‑world problem‑solving.
“It was enjoyable, and I felt accomplished doing something like this,” said Drew T.
How Students Drove the Science
Student teams owned the methodology. They selected safe filming angles, standardized procedures (avoiding cars braking near yellow or red lights), and debated threshold choices. If a group mismeasured the reference length, they reanalyzed all of their footage.
“My experience was a little challenging as I kept getting negative numbers, but I eventually figured it out with the help of peers and Mr. Watkins,” said Saniyalynn S.
Those moments turned into valuable discussions about expectations and data quality. Vernier Video Analysis gave instant feedback, but students learned that the data was only as good as their setup. They learned to question unexpected results and identify issues in their setup that might need adjustments.
The conversation kept returning to measurement quality and argument from evidence—a natural fit with NGSS practices (including Analyzing and Interpreting Data, Constructing Explanations, and Engaging in Argument from Evidence).
Just as important, students connected physics to lived experience. They could point to a stretch of road, explain why the geometry of the corridor matters, and show how a best-fit line translates to the car speed that a pedestrian experiences at the curb. This is the difference between answering a worksheet and making a public case with data.
What We Hope to See
Our class didn’t stop with analysis. Drawing on the student report and the research they summarized, we developed a set of realistic recommendations for improving pedestrian safety on 112th Street:
- Install a speed radar sign in front of Franklin Pierce High School to reduce median speeds and increase driver awareness on the four-lane 112th corridor.
- Add school-zone and crosswalk signage with earlier sightlines for eastbound traffic entering the narrower section.
- Coordinate district and county roles for funding and installation consistent with state standards.
This project taught us that scientific data can be a powerful lever for civic change—and that policy work requires patience and persistence. We’re continuing to share our findings with local officials and community partners, hoping to see at least one tangible safety improvement come out of this research. Even if that’s just a single sign, it represents a student-led change driven by data, engagement, and physics.

Nick teaches physics, Earth science, and physical science at Franklin Pierce High School in Tacoma, WA, and is a member of the Vernier Trendsetters Community. With over a decade of experience in K–12 science education and a National Board Certified Teacher, Nick is passionate about inspiring students to investigate the physical world through hands-on investigations. Outside of the classroom, you can find him @PNWPhysics
Share this Article
Related Articles


Sign up for our newsletter
Stay in the loop! Beyond Measure delivers monthly updates on the latest news, ideas, and STEM resources from Vernier.