Sharing ideas and inspiration for engagement, inclusion, and excellence in STEM
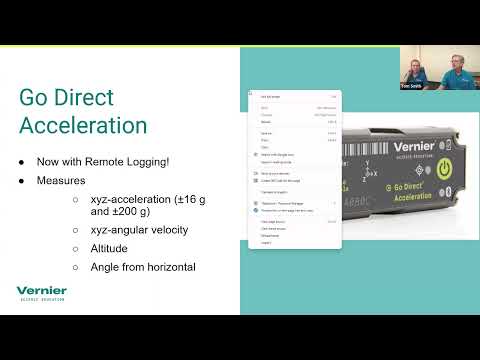
For many students, an amusement park trip is more than just a reward at the end of a school year—it can be the real-world experience that actually makes applied physics click. As Vernier physics and engineering specialist Josh Ence recently shared during our roller coaster physics webinar, he once had students sign up for AP Physics simply because they knew the class would end with a roller coaster field trip.
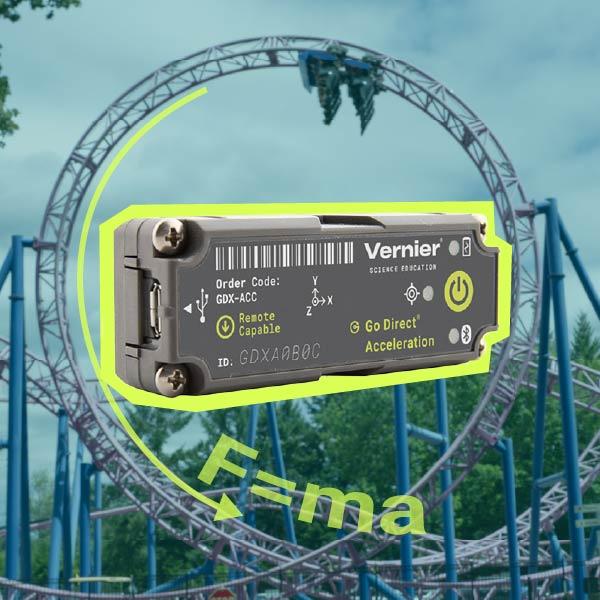
When paired with Vernier technology, an amusement park becomes a full‑scale laboratory. The Go Direct® Acceleration Sensor, Vernier Graphical Analysis® Pro, and Vernier Video Analysis® help teachers transform adrenaline‑pumping loops, drops, and swings into NGSS-aligned investigations that make core physics concepts real and memorable.
Remote Data Logging Made Easy with Go Direct Acceleration
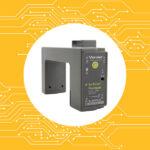
One of the biggest challenges of data collection is that students can’t carry their laptops on the rides, and even with Bluetooth® wireless technology, it can be difficult to predict when a ride might push the sensor out of range. That’s where our new remote data logging feature makes a huge difference. This feature, which enables select Go Direct sensors to collect sensor data without any active connection to a device, is available on the Go Direct Acceleration Sensor.
Educators can set the sensor to trigger on an event—such as acceleration exceeding a certain threshold or a change in altitude—before students even board the ride. Once the ride is over, reconnecting the sensor prompts students to download their stored data for analysis.
Tip: Orientation is key for making sense of acceleration data.
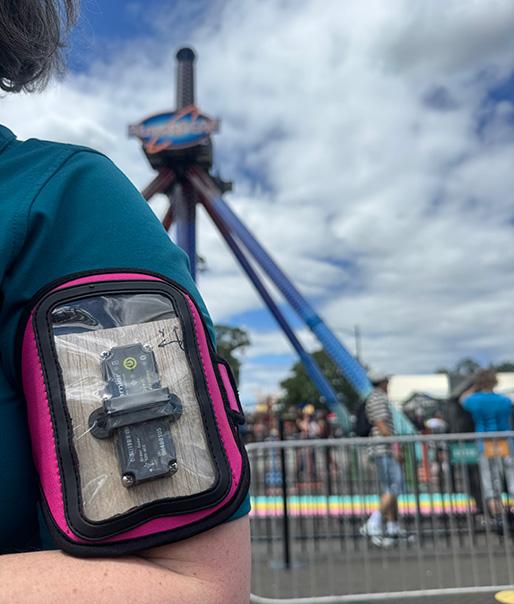
The Go Direct Acceleration Sensor collects xyz acceleration and angular velocity, which means orientation matters. One way to keep axes clearly defined and consistent is to use a gadget like the one Vernier Director of Physics Fran Poodry devised: an arm band phone case with a small balsa wood insert, labeled with axes, that stabilizes the sensor. This setup makes it easy to interpret whether measured acceleration is up, forward, or sideways.
Alternatively, Josh Ence advises that simply keeping the sensor in a front pocket oriented in the same direction is fine for most rides, although less reliable when inverted on a pendulum swing. Of course, raising your arms and screaming with the arm band version might throw off your orientation, too!
Experiment Highlights from the Park
The Vernier team took a field trip to a small, local amusement park in Portland, Oregon, and collected data from several common types of rides you could find at just about any amusement park in your area. Here are a few ideas to get you started.
Tree Top Drop
This seemingly small “kiddie ride” offered big physics payoffs. Students can explore free fall and angular velocity by comparing vertical acceleration and altitude data to their own sensation of weightlessness at the top of the drop. In Graphical Analysis Pro, syncing video to the data replay makes it easy to see acceleration spike on the way down and drop to near zero at the peak.
NGSS Connection HS-PS2-1: Analyze data to support the claim that Newton’s second law of motion describes the mathematical relationship among the net force on a macroscopic object, its mass, and its acceleration.

Roller Coaster Loops
Collecting acceleration data during roller coaster loops gives students the opportunity to investigate conservation of energy, centripetal force, and projectile motion. With Vernier Video Analysis, students can track motion frame by frame, and then calculate velocity and acceleration to confirm why riders stay pressed in their seats at the top of the loop. The combination of synced data and video is a really effective way for students to deepen their understanding of energy transformations.
NGSS Connection HS-PS3-2: Develop and use models to illustrate that energy at the macroscopic scale can be accounted for as a combination of energy associated with the motion of particles (objects) and energy associated with the relative positions of particles (objects).
Tip: Follow these best practices to get a strong video that produces clean data.


AtmosFEAR Pendulum
This ride acts as a giant physical pendulum system, swinging back and forth while occasionally inverting. The Go Direct Acceleration Sensor captured the ride’s motion in three dimensions, giving students a powerful way to see how complex movements play out across multiple axes at once. The swinging motion—and occasional inversion—also really illustrates why sensor orientation matters.
NGSS Connection HS-PS2-1: Analyze data to support the claim that Newton’s second law of motion describes the mathematical relationship among the net force on a macroscopic object, its mass, and its acceleration.

Together, these examples illustrate how a trip to the amusement park can be a rich opportunity to create engaging, educational case studies of core physics principles.
Educator Tips for Planning a Physics Day
Pulling off a successful physics field trip requires more than just bus reservations. Here are some classroom-tested tips to make your trip a success:
- Start early. Logistics like permission slips, group management, and parent approvals go smoother with lead time
- Practice before you go. Students should test remote logging and triggering methods in the classroom, so they know what to expect at the park.
- Plan for file management. A few laptops with a shared cloud drive can help collect and organize data efficiently. Naming conventions for rides, groups, and times are also important.
- Think about video. The best analyses come from pairing sensor data with video. Scout locations in advance for clear views, and bring a meter stick or ruler to provide a scale in your video.
- Use existing resources. Clarence Bakken’s Amusement Park Physics book (available from the AAPT bookstore) and Six Flags Physics Day guides provide excellent ride-specific activity ideas.
Why Amusement Park Physics Works
At its core, amusement park physics is about making science tangible. Students don’t just hear about acceleration, energy conservation, or pendulum motion—they feel it in their bodies and see it in their data.
That alignment between hands-on experience and quantitative analysis is what makes this approach three-dimensional and impactful for students. Want more tips for getting started? Check out our free on-demand webinar covering this topic and download sample data from the rides!
Have questions or want to share how you teach amusement park physics? Reach out to us at physics@vernier.com, call 888‑837‑6437, or explore more on our physics page.
Share this Article
Related Articles


Sign up for our newsletter
Stay in the loop! Beyond Measure delivers monthly updates on the latest news, ideas, and STEM resources from Vernier.