Pressure-Temperature Relationship in Gases
Experiment #7 from Chemistry with Vernier
- Education Level
- High School
- Subject
- Chemistry
Introduction
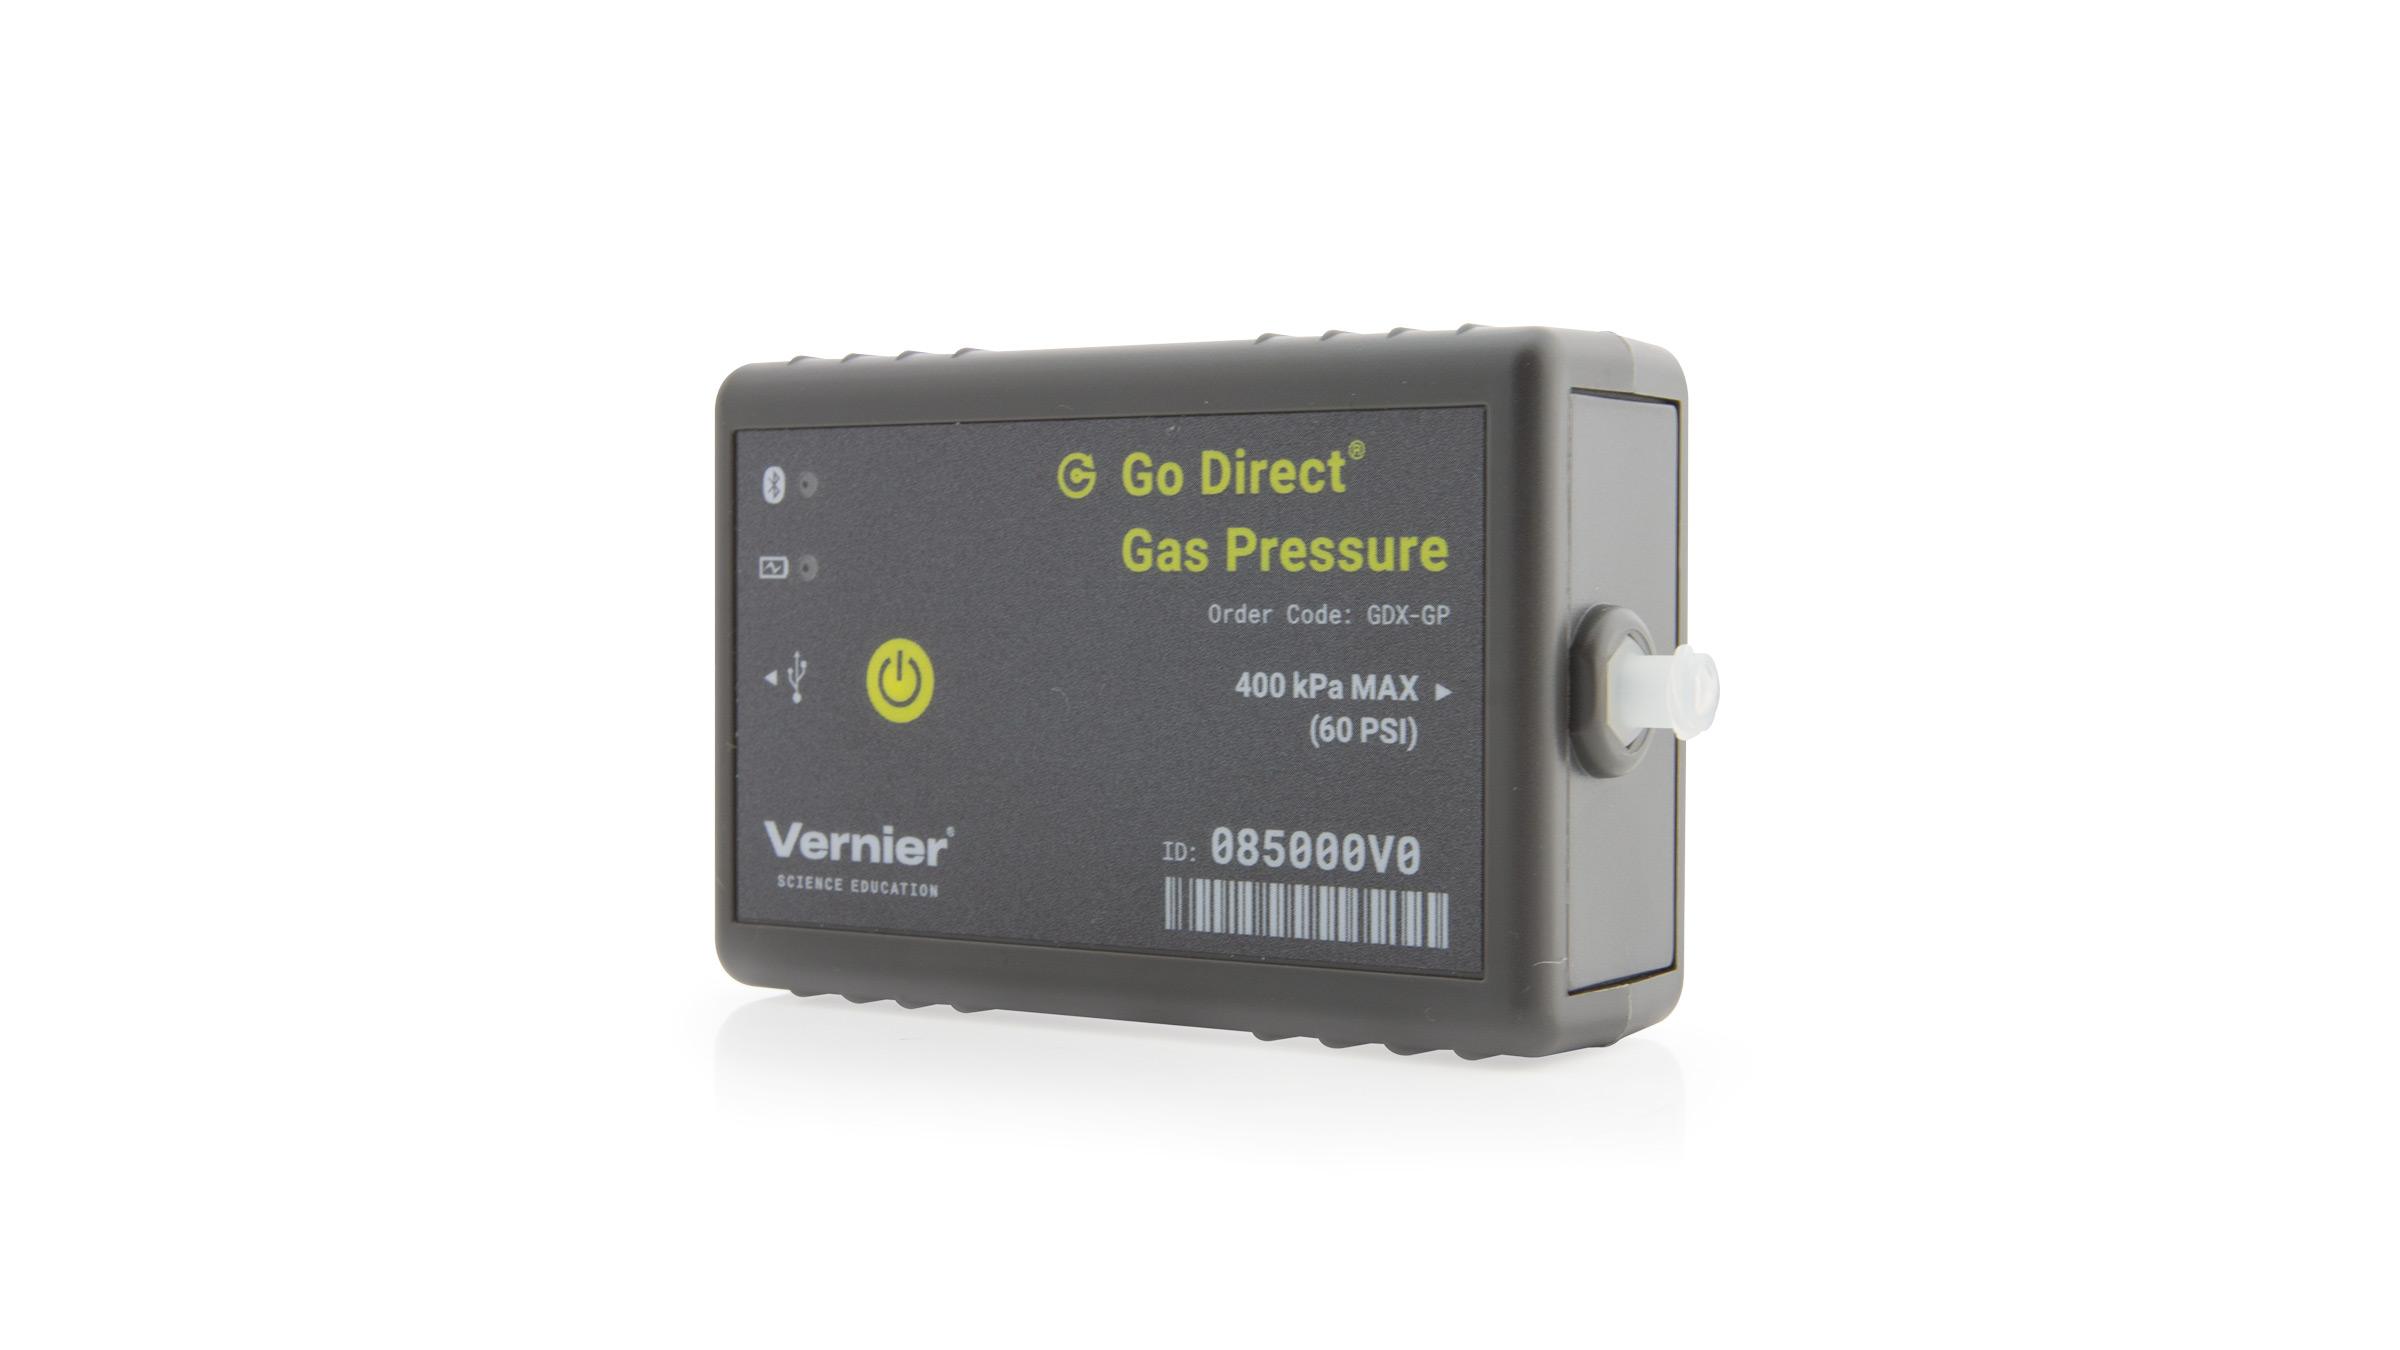
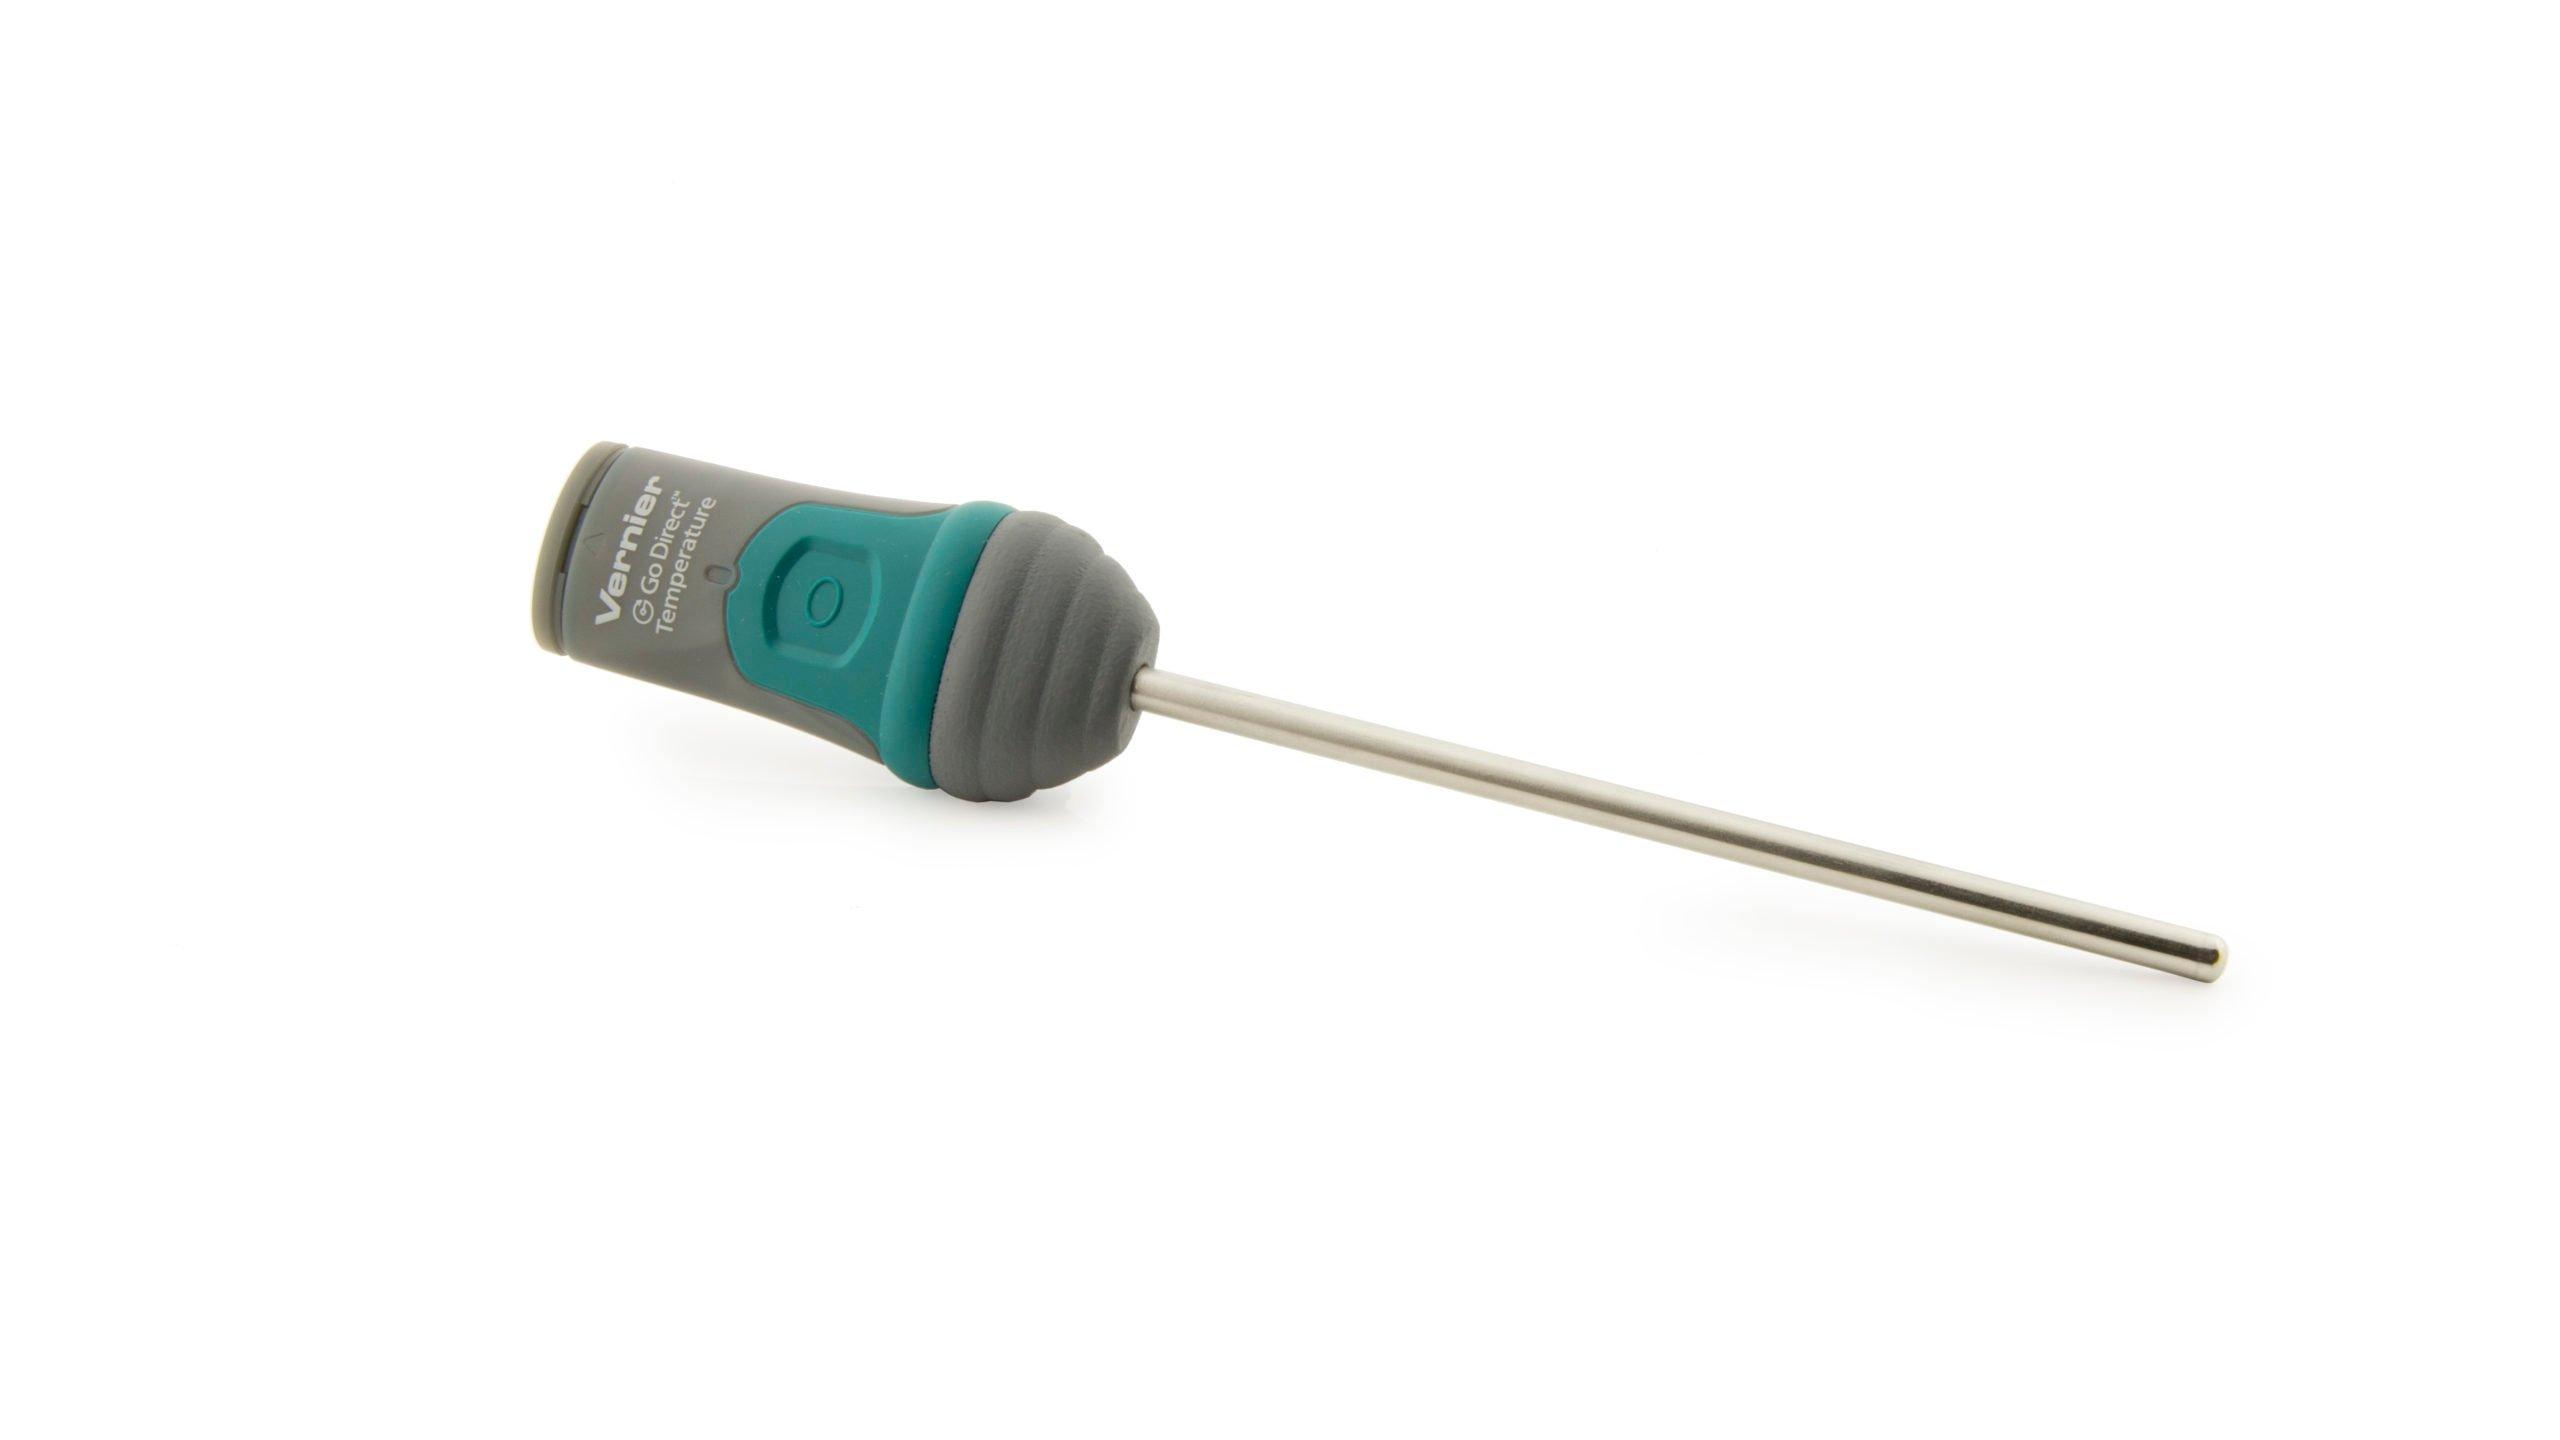
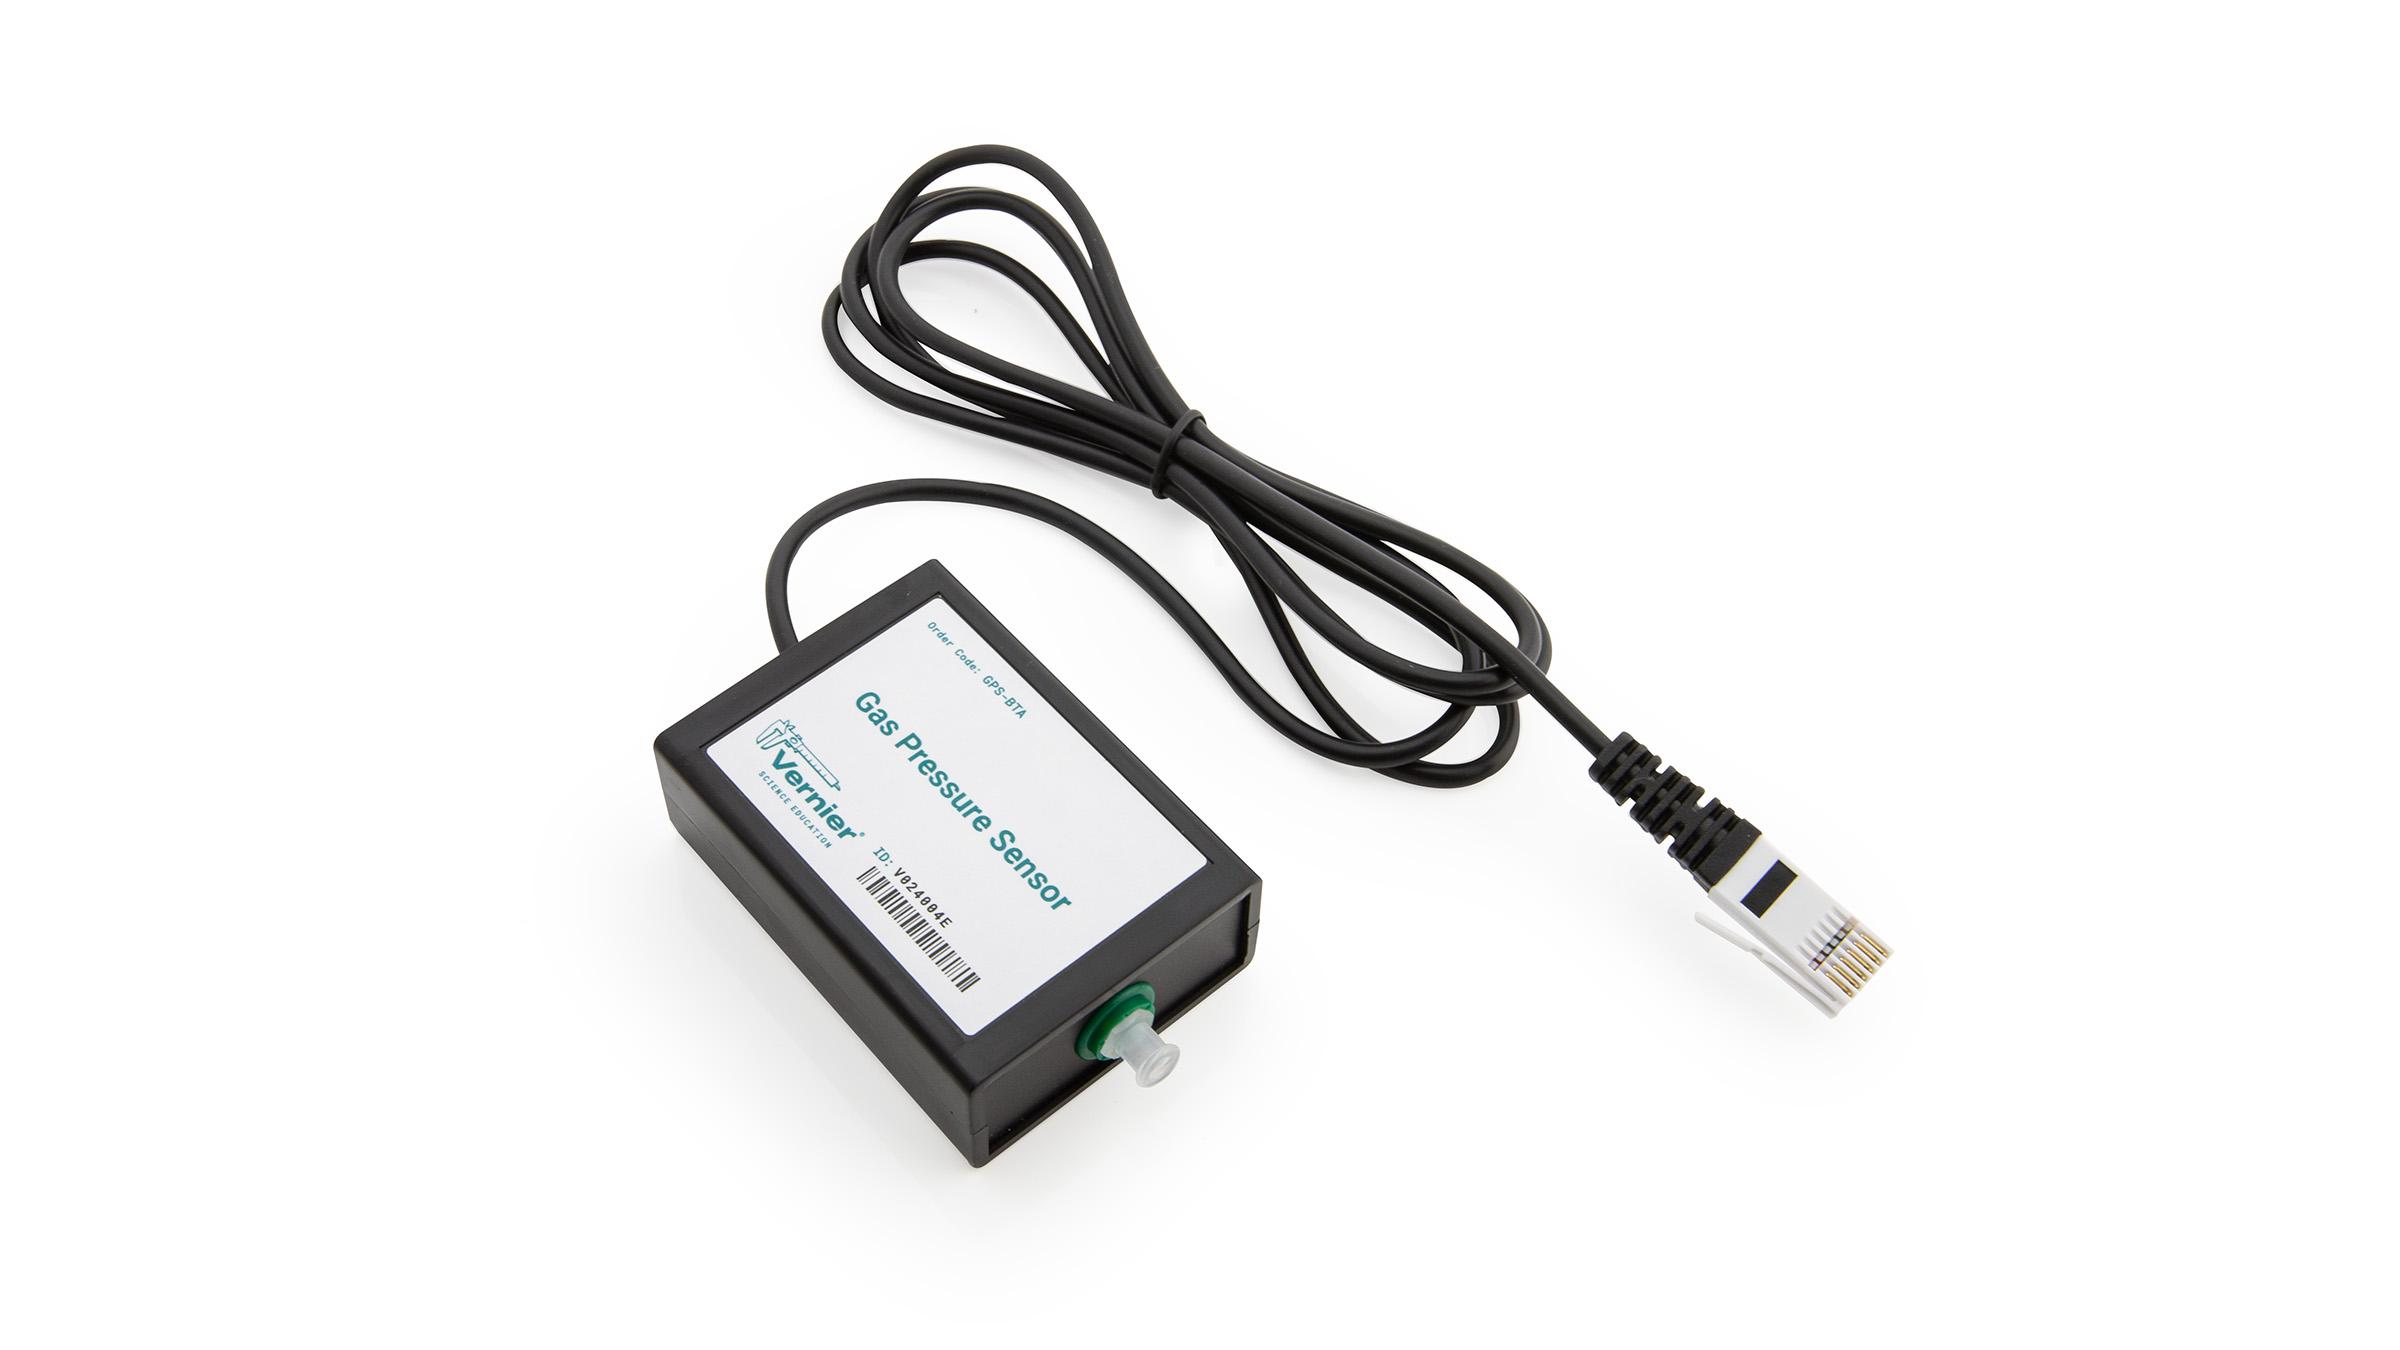
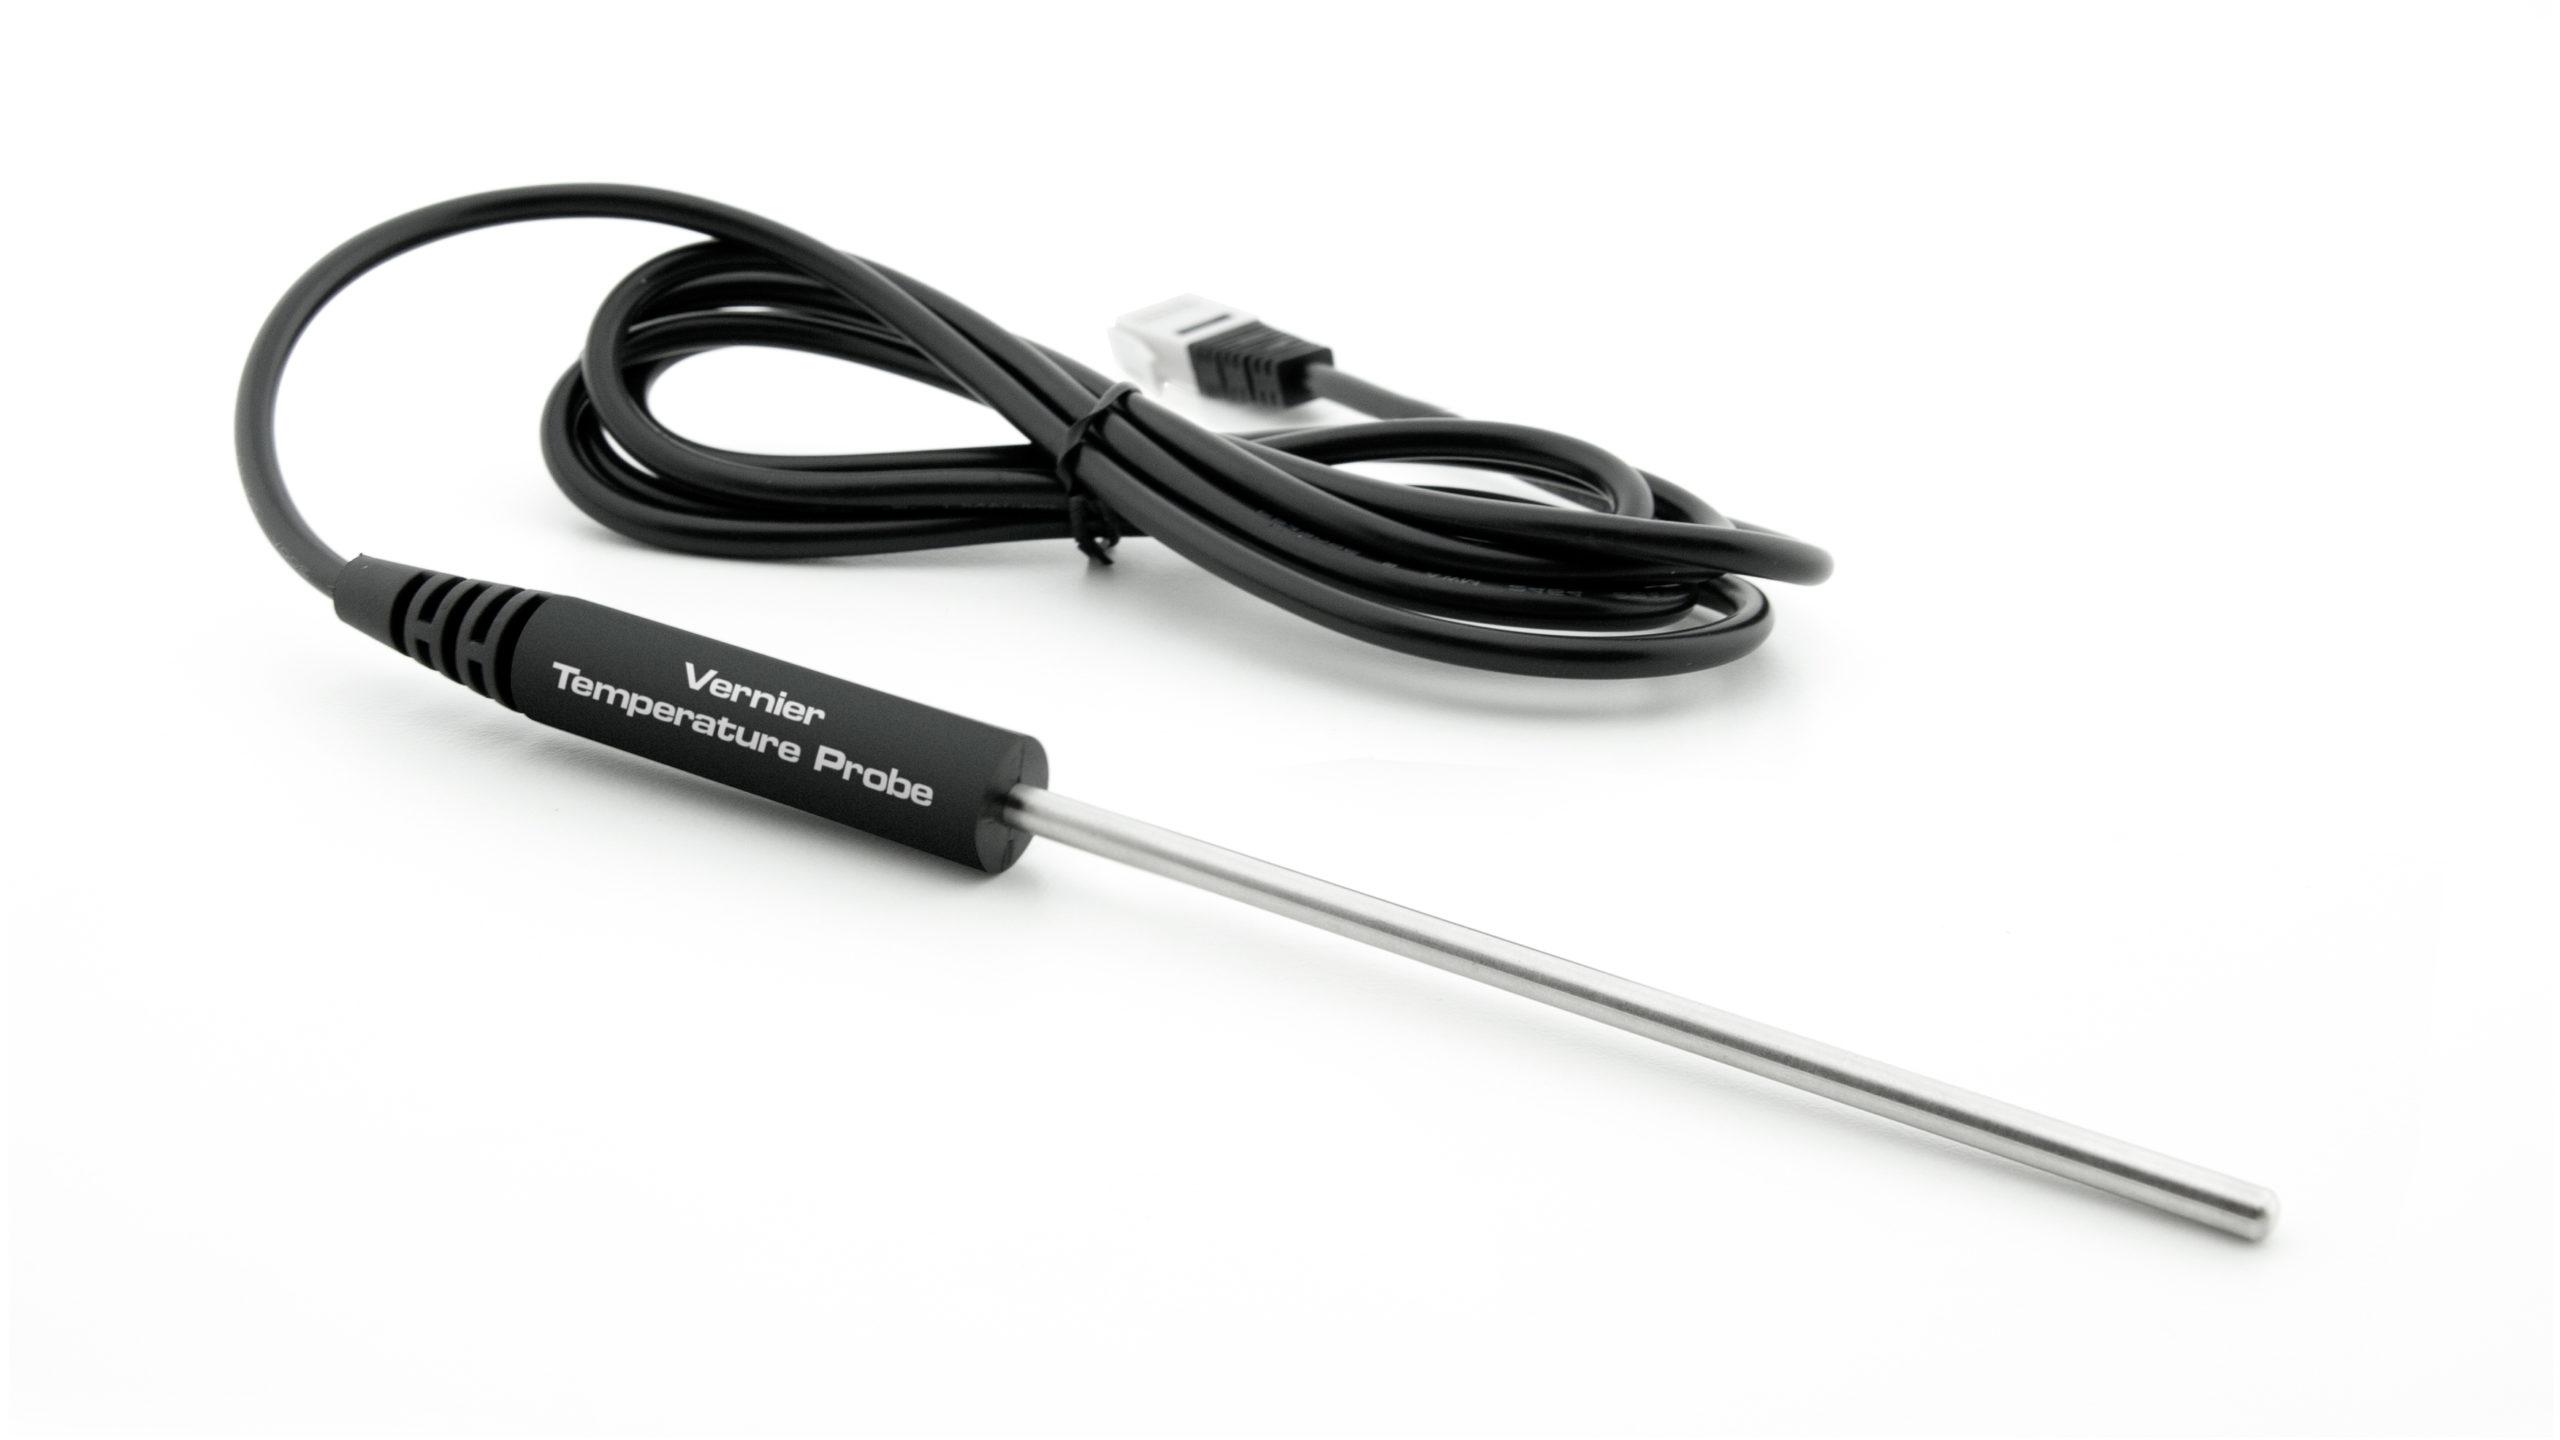
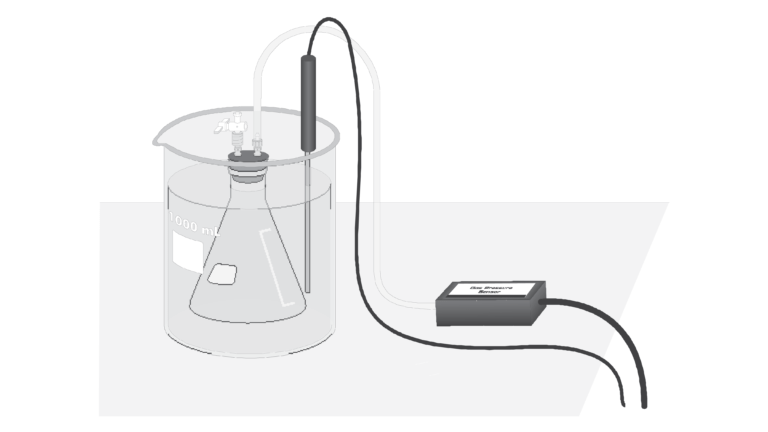
Gases are made up of molecules that are in constant motion and exert pressure when they collide with the walls of their container. The velocity and the number of collisions of these molecules are affected when the temperature of the gas increases or decreases. In this experiment, you will study the relationship between the temperature of a gas sample and the pressure it exerts. Using the apparatus, you will place an Erlenmeyer flask containing an air sample in water baths of varying temperature. Pressure will be monitored with a Gas Pressure Sensor and temperature will be monitored using a Temperature Probe. The volume of the gas sample and the number of molecules it contains will be kept constant. Pressure and temperature data pairs will be collected during the experiment and then analyzed. From the data and graph, you will determine what kind of mathematical relationship exists between the pressure and absolute temperature of a confined gas. You may also do the extension exercise and use your data to find a value for absolute zero on the Celsius temperature scale.
Objectives
In this experiment, you will
- Study the relationship between the temperature of a gas sample and the pressure it exerts.
- Determine from the data and graph, the mathematical relationship between the pressure and absolute temperature of a confined gas.
- Find a value for absolute zero on the Celsius temperature scale.
Sensors and Equipment
This experiment features the following sensors and equipment. Additional equipment may be required.
Ready to Experiment?
Ask an Expert
Get answers to your questions about how to teach this experiment with our support team.
- Call toll-free: 888-837-6437
- Chat with Us
- Email support@vernier.com
Purchase the Lab Book
This experiment is #7 of Chemistry with Vernier. The experiment in the book includes student instructions as well as instructor information for set up, helpful hints, and sample graphs and data.

