Introduction
Blood pressure is a measure of the fluid pressure within the circulatory system. This pressure is required to ensure the delivery of oxygen and nutrients to, and the removal of carbon dioxide and waste products from, tissues. Blood pressure varies from a peak pressure produced by the contraction of the left ventricle, to a low pressure produced by ventricular relaxation. The peak pressure is called systole, and the pressure that is maintained while the left ventricle is relaxing is called diastole. The average pressure is the mean arterial pressure or MAP. Blood pressure is traditionally reported with the systolic pressure stated first and the diastolic pressure stated second. In adults, 120/80 and below is considered normal blood pressure. High blood pressure (also called hypertension) is a major risk factor for a number of health problems including strokes and congestive heart failure. In adults, 140/90 and above is considered high blood pressure.
Objectives
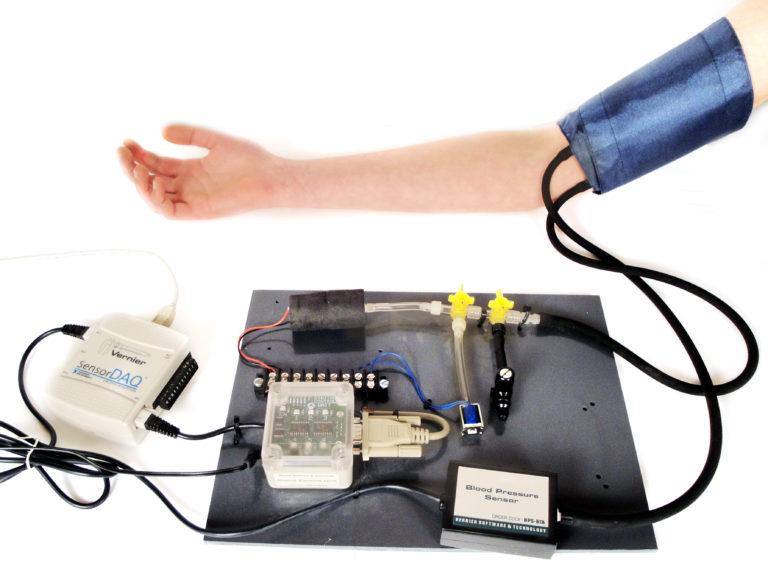
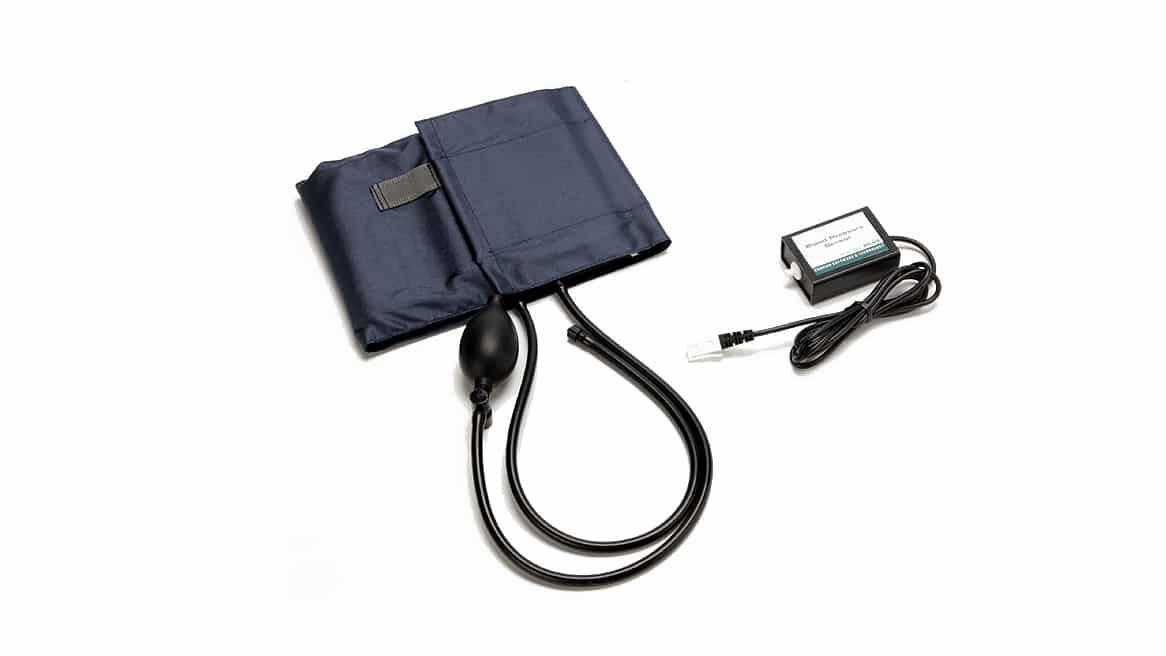
In this Project, you will write a LabVIEW program to display the blood pressure of a test subject. You will use a Vernier Blood Pressure Sensor, a non-invasive unit that includes a handheld pump, pressure release valve, and cuff. The cuff is placed on the upper arm to pressurize the arteries, just like other blood pressure monitoring devices. The sensor connects to the cuff and is used to monitor the pressure in the cuff in units of mm Hg. The cuff is pressurized with the pump. The pressure release valve slowly releases pressure out of the cuff. Your front panel design should include a graphical cuff pressure versus time display with a large, easily readable indicator for live cuff pressure readings. You should have the program provide a visual or audible signal when the cuff pressure has reached 160 mm Hg as a signal to stop inflating the cuff. When data collection ends, the VI should use the recorded cuff pressure to calculate and display the test subject’s systolic and diastolic blood pressures.
Sensors and Equipment
This experiment features the following sensors and equipment. Additional equipment may be required.
Ready to Experiment?
Ask an Expert
Get answers to your questions about how to teach this experiment with our support team.
- Call toll-free: 888-837-6437
- Chat with Us
- Email support@vernier.com
Purchase the Lab Book
This experiment is #9 of Engineering Projects with NI LabVIEW and Vernier. The experiment in the book includes student instructions as well as instructor information for set up, helpful hints, and sample graphs and data.