Introduction
The adaptability of the heart can be observed during exercise, when the metabolic activity of skeletal muscles increases. The cardiovascular system, consisting of the heart and blood vessels, responds to exercise with an increase in heart rate and strength of contraction with each beat, resulting in a higher cardiac output (cardiac output = quantity of blood pumped through the heart per unit of time) and blood pressure. Positive pressure is created by forceful contraction of the left ventricle of the heart, measured as systole. It is maintained during relaxation of the ventricle by closure of the aortic valve and recoil of arteries, measured as diastole.
Mean arterial pressure (MAP) is a useful measure of the adequacy of tissue perfusion, and is not a simple average of systolic and diastolic blood pressures. This is because diastole continues for twice as long as systole. MAP can be reasonably approximated using the equation:
)}} {3}{\text{ = }}MAP")
Objectives
In this experiment, you will
- Obtain graphic representation of heart rate and blood pressure.
- Determine the effect of exercise on heart rate, and systolic, diastolic and mean arterial pressures.
- Use blood pressure readings and pulse to infer changes in cardiac output and peripheral vascular resistance with exercise.
- Correlate the fitness level of individuals with amount of daily exercise.
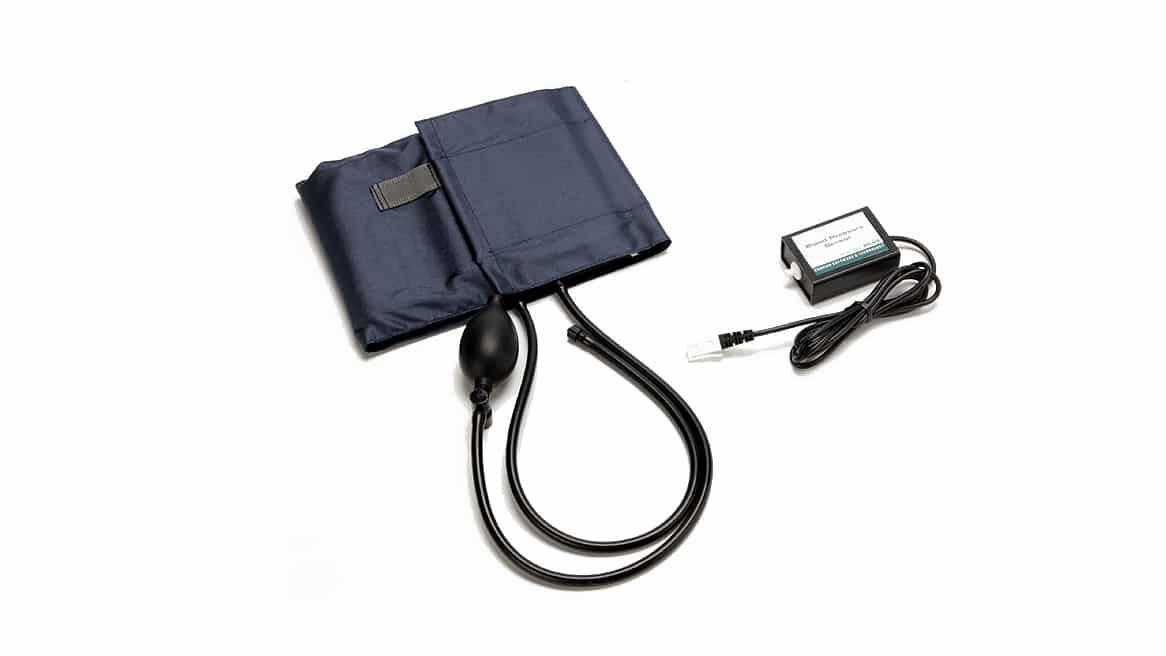
Sensors and Equipment
This experiment features the following sensors and equipment. Additional equipment may be required.

Ready to Experiment?
Ask an Expert
Get answers to your questions about how to teach this experiment with our support team.
- Call toll-free: 888-837-6437
- Chat with Us
- Email support@vernier.com
Purchase the Lab Book
This experiment is #11 of Human Physiology with Vernier. The experiment in the book includes student instructions as well as instructor information for set up, helpful hints, and sample graphs and data.