Effect of Load on Wind Turbine Output
Experiment #9 from Renewable Energy with Vernier
- Education Level
- High School
Introduction
Electricity is used to run many things in our daily lives, and each device that uses electricity can be considered a load. A load uses electrical energy to accomplish its task. The simplest form of a load is a resistor, which converts electrical energy into thermal energy. In most cases, resistors are used to adjust the amount of energy getting to part of a device by changing a voltage or diverting a current, but in a few cases thermal energy is the desired result, as with space heaters and toasters.
If you have done Experiment 5 “Current and Resistors,” you found that as the amount of load (resistance) in a circuit increases, the current decreases. You also found that as you change the amount of load in the circuit, the voltage changes only a small amount. If you have done Experiment 8 “Exploring Wind Turbines,” you found that when voltage and/or current increases in a circuit, the amount of power also increases.
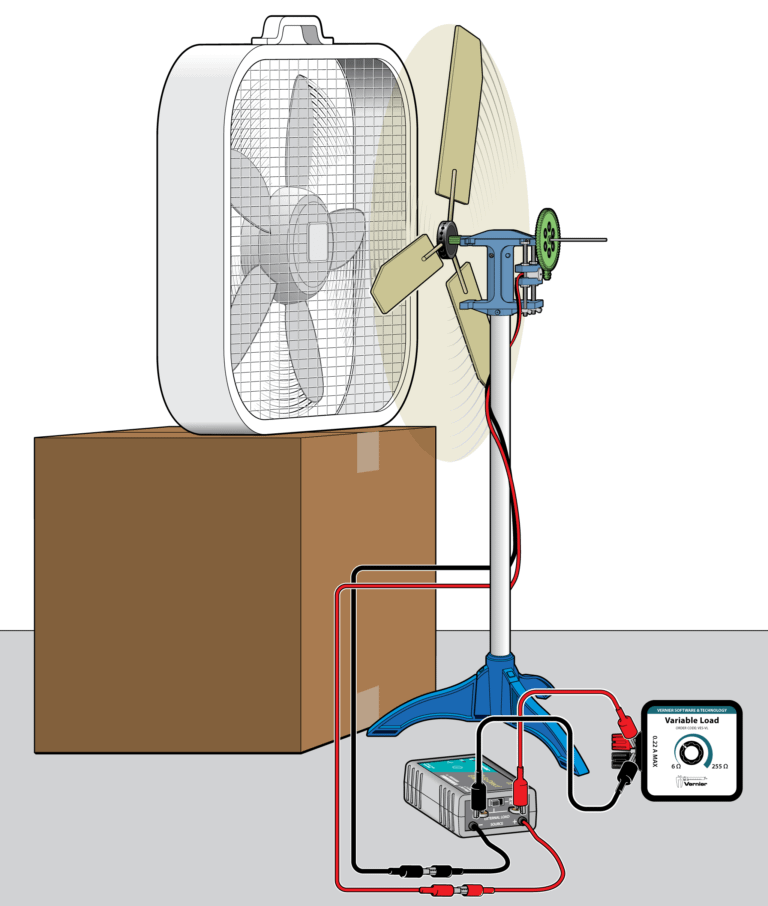
In this experiment, you will measure the power output of a wind turbine and determine the optimal load. That is, you will determine the resistance for which the power output is greatest. You will then compare the optimal load to the internal resistance of the generator.
Objectives
- Determine how power output of turbine varies depending on the resistance (load) in the circuit.
- Compare internal resistance and optimal load.
Sensors and Equipment
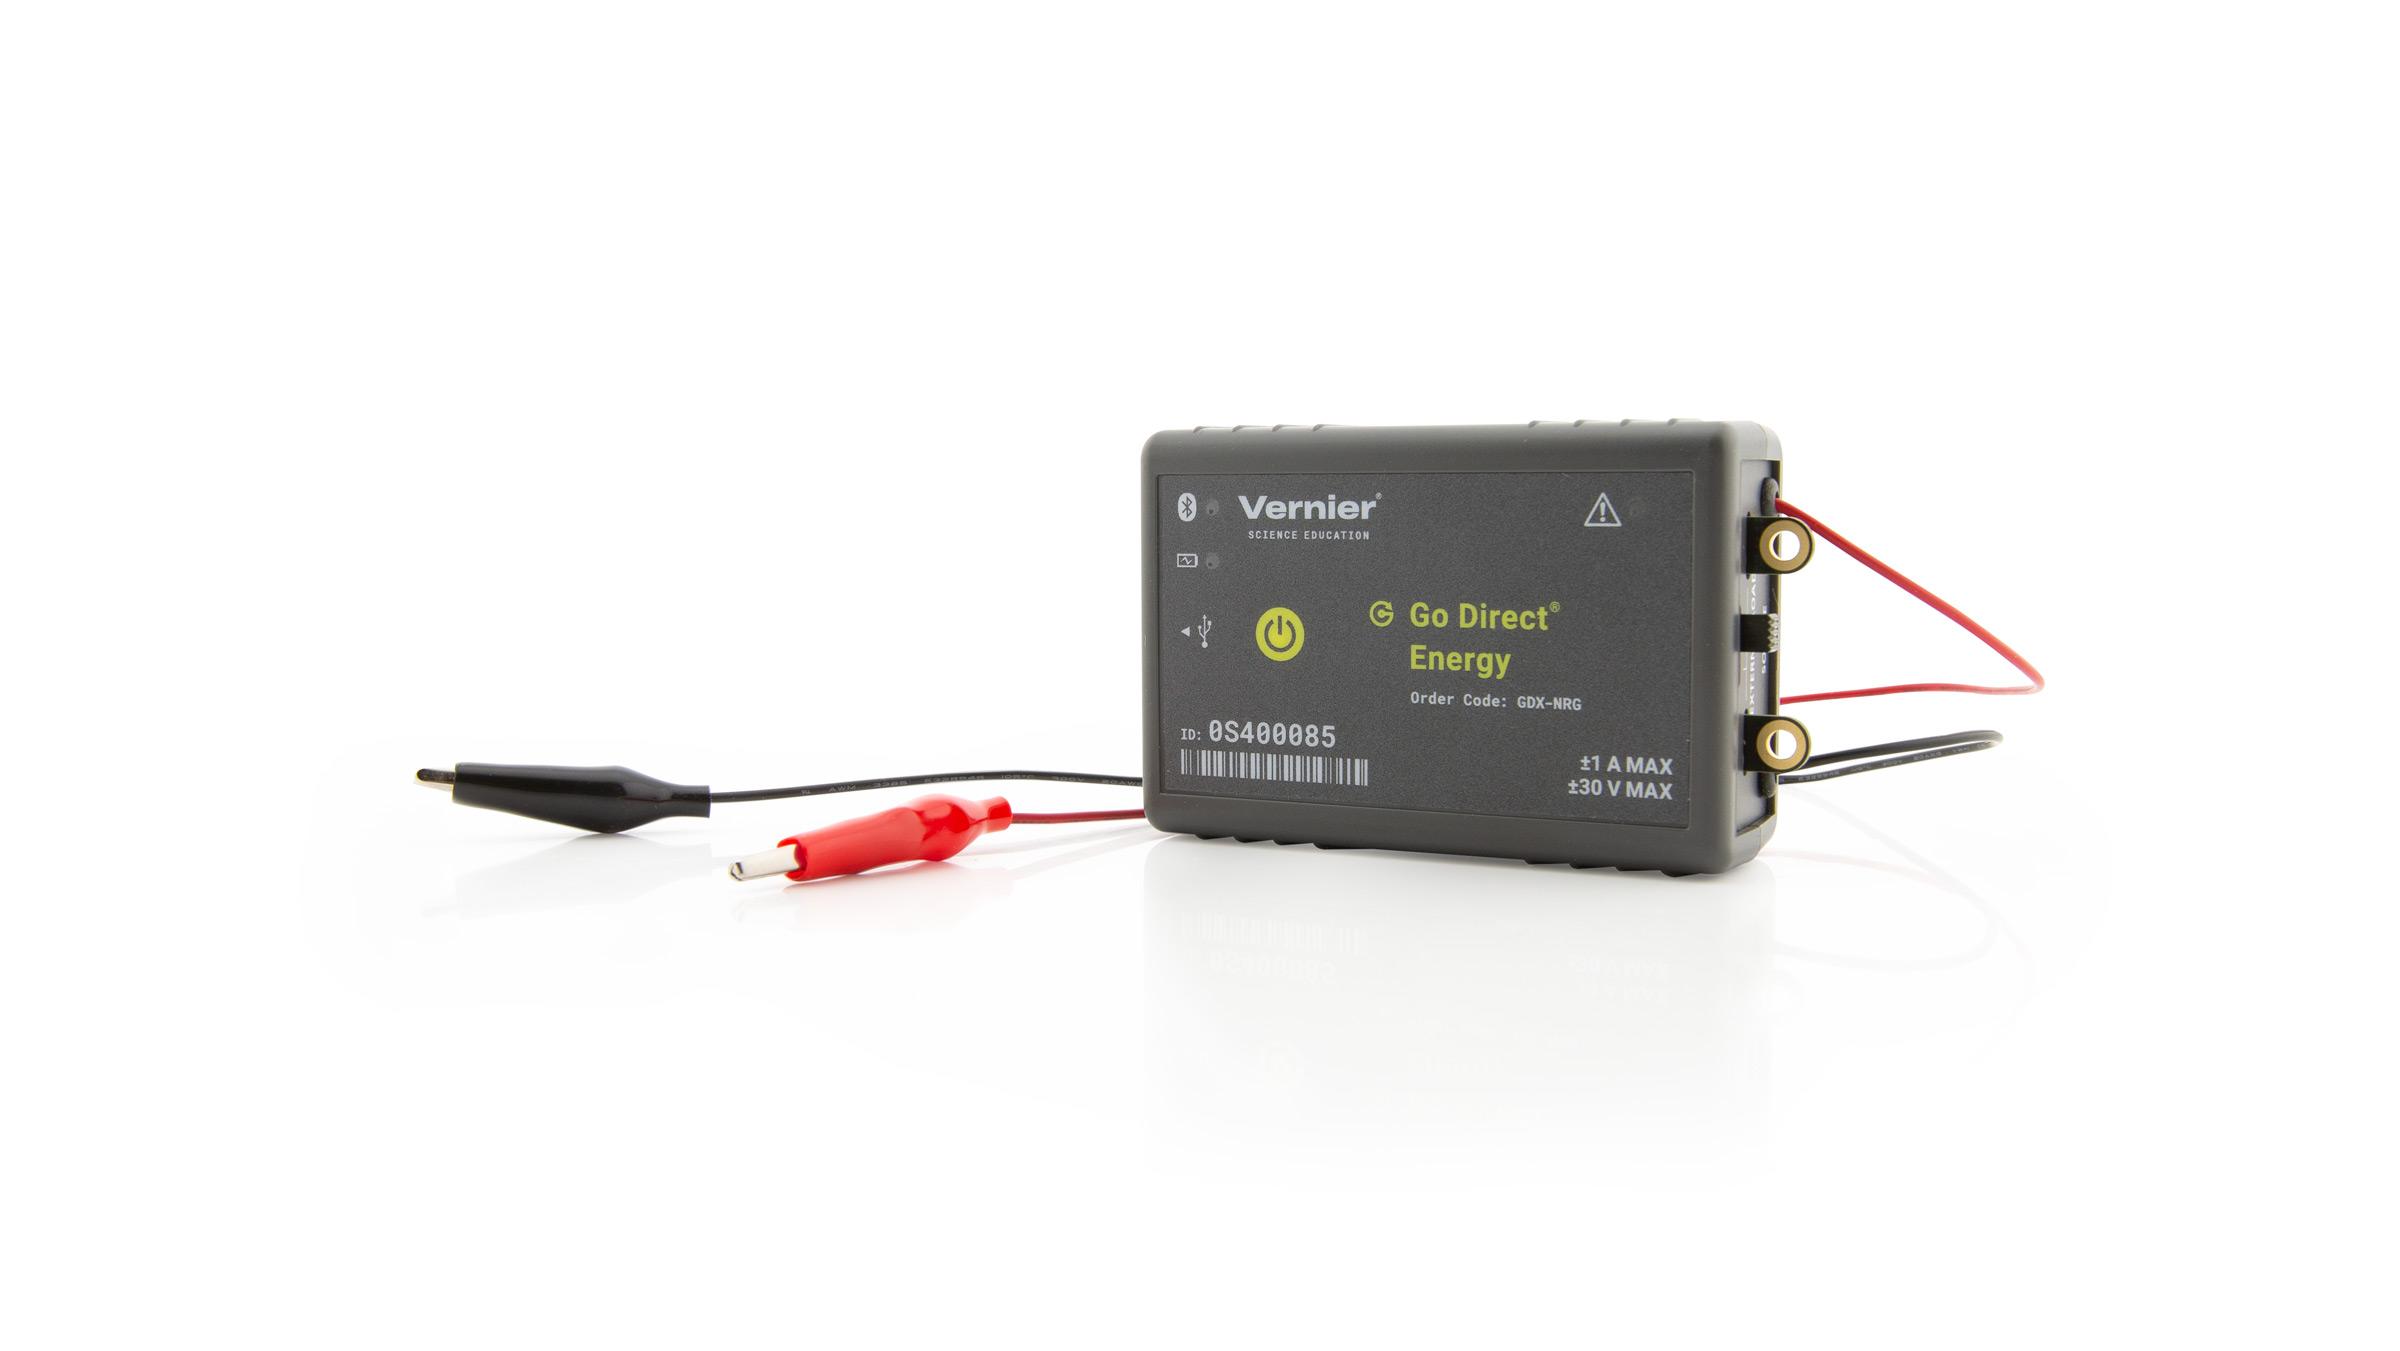
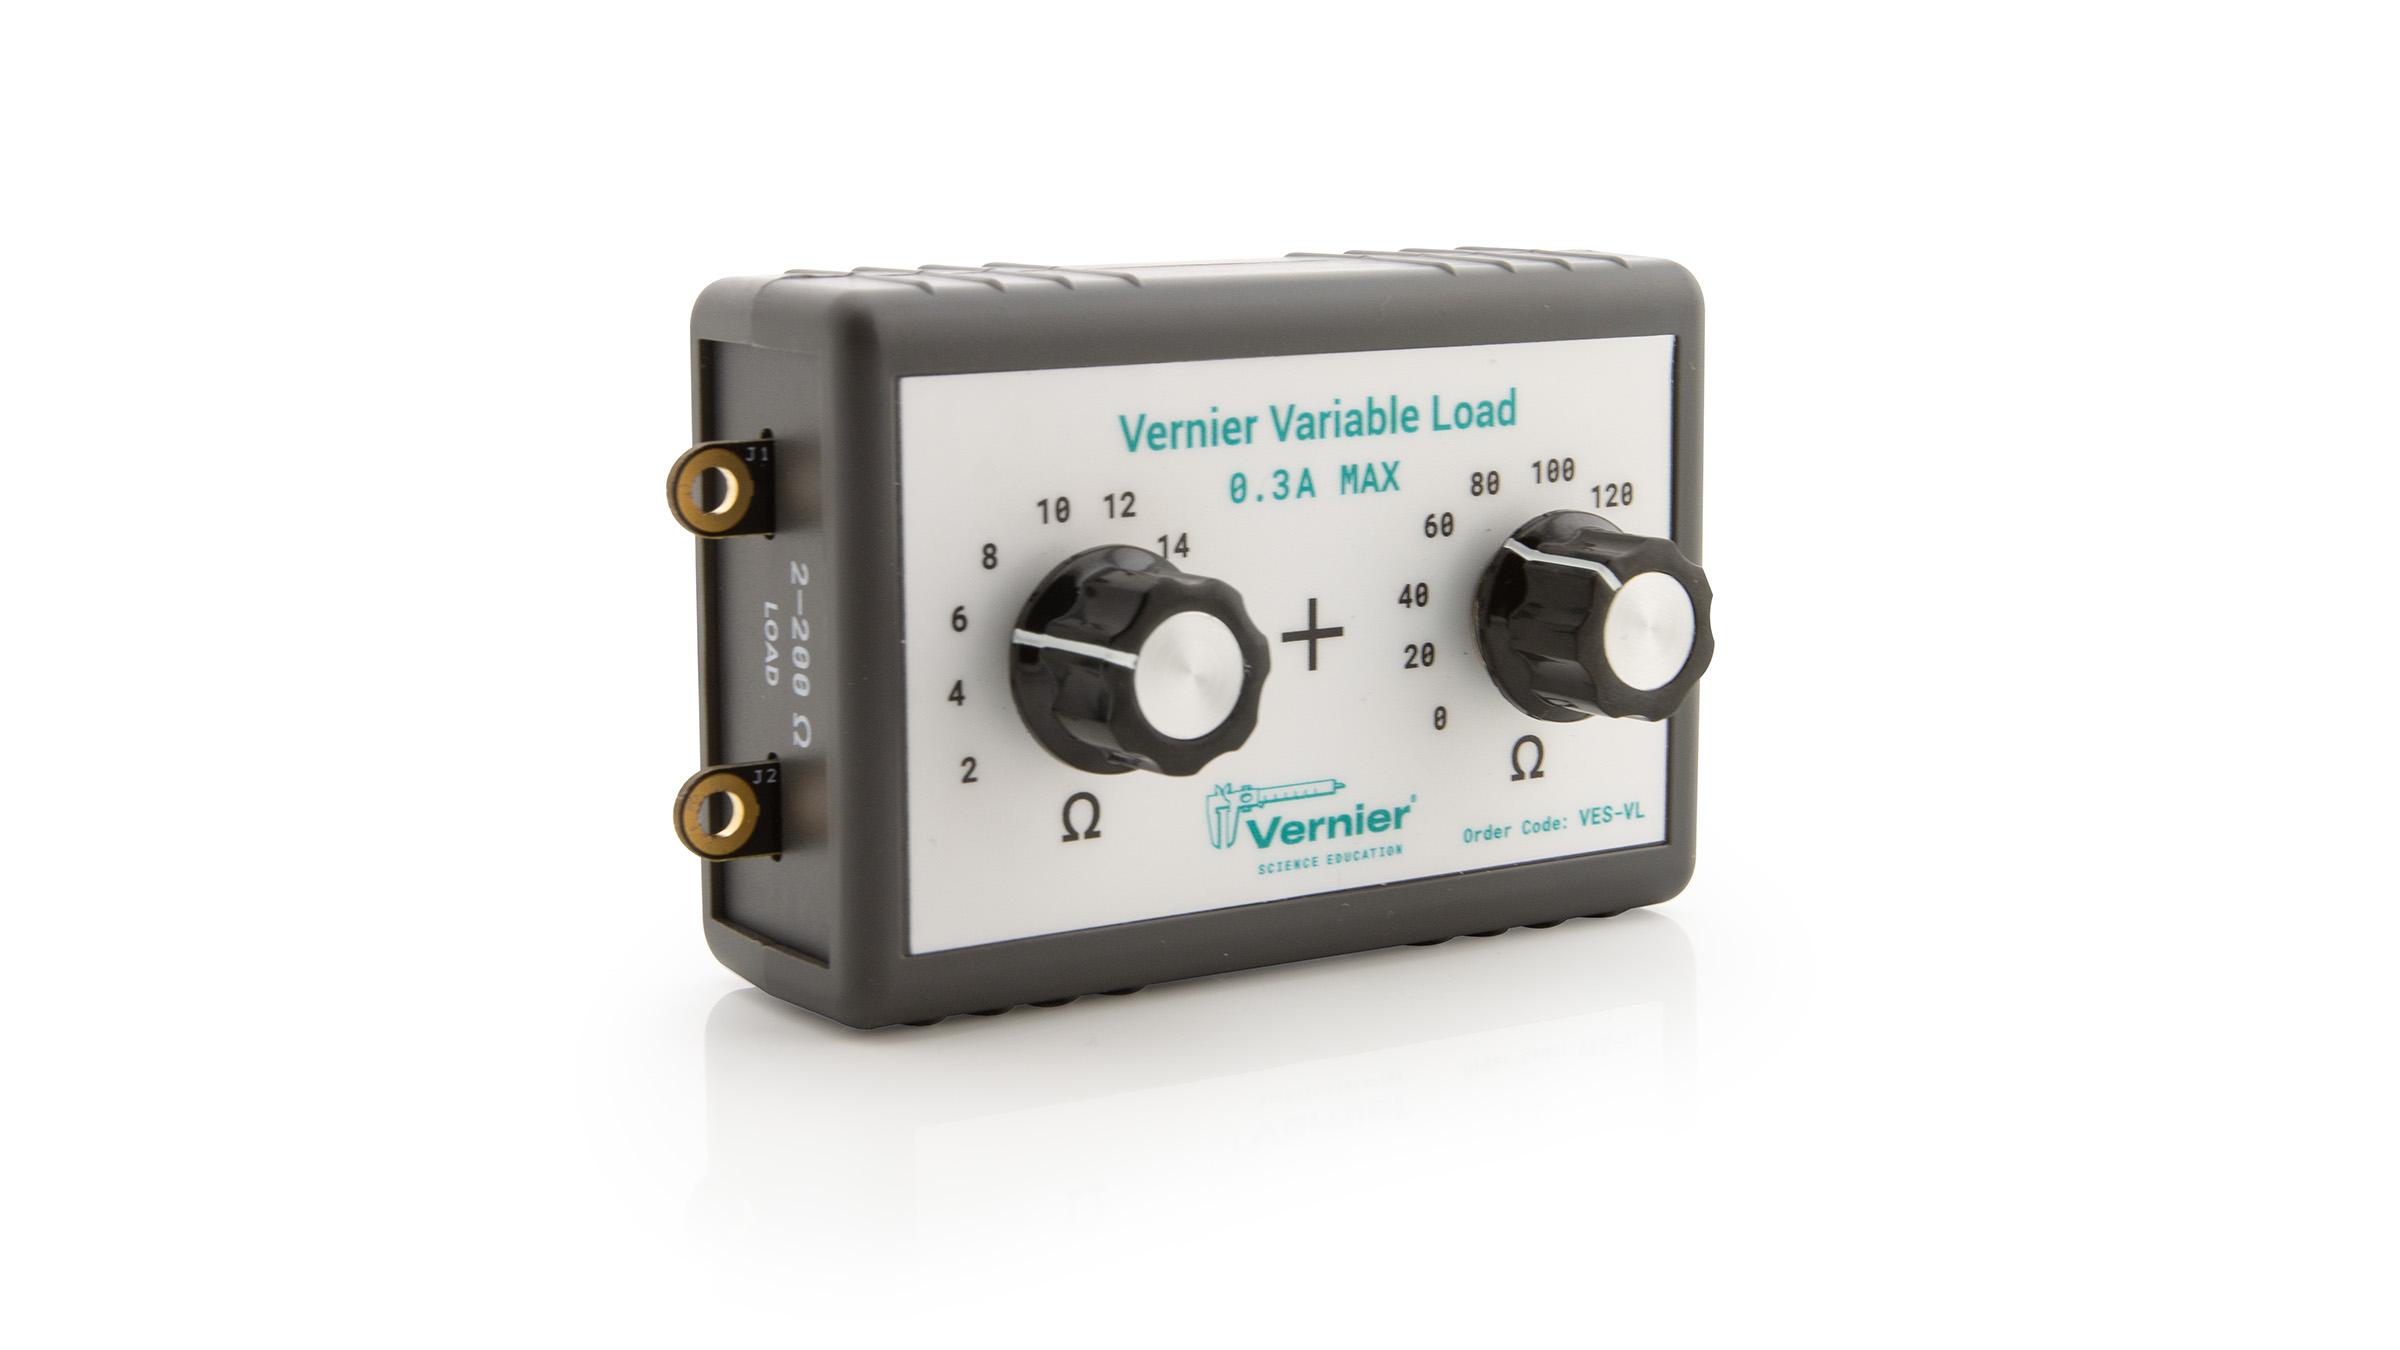
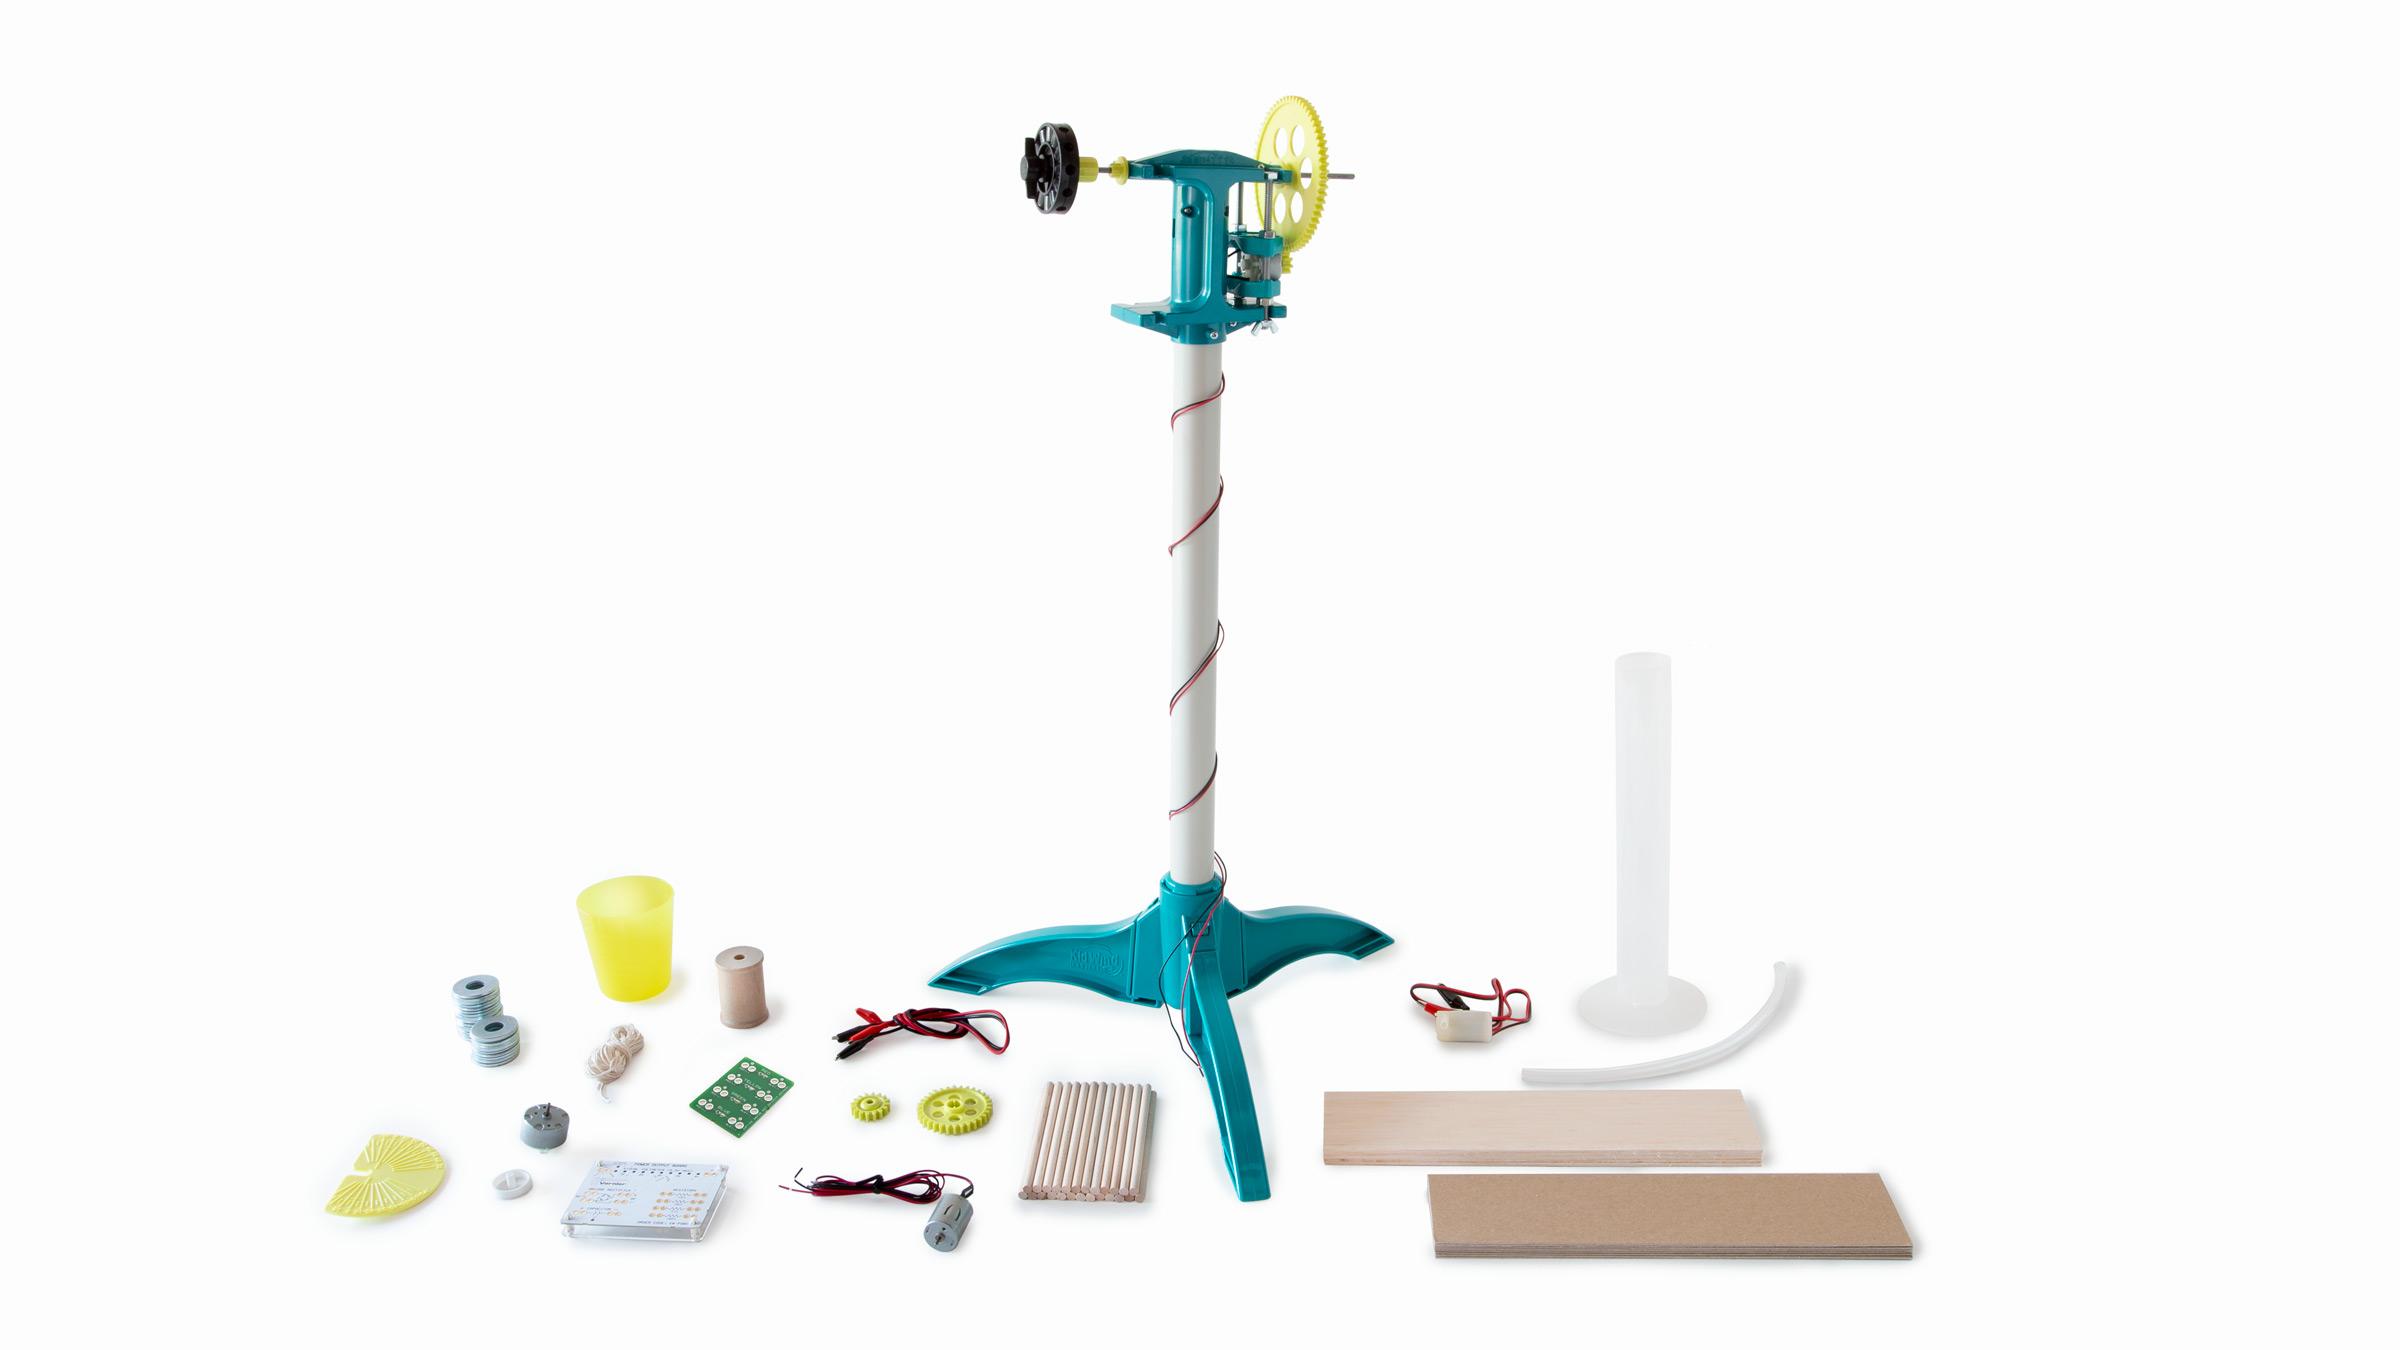
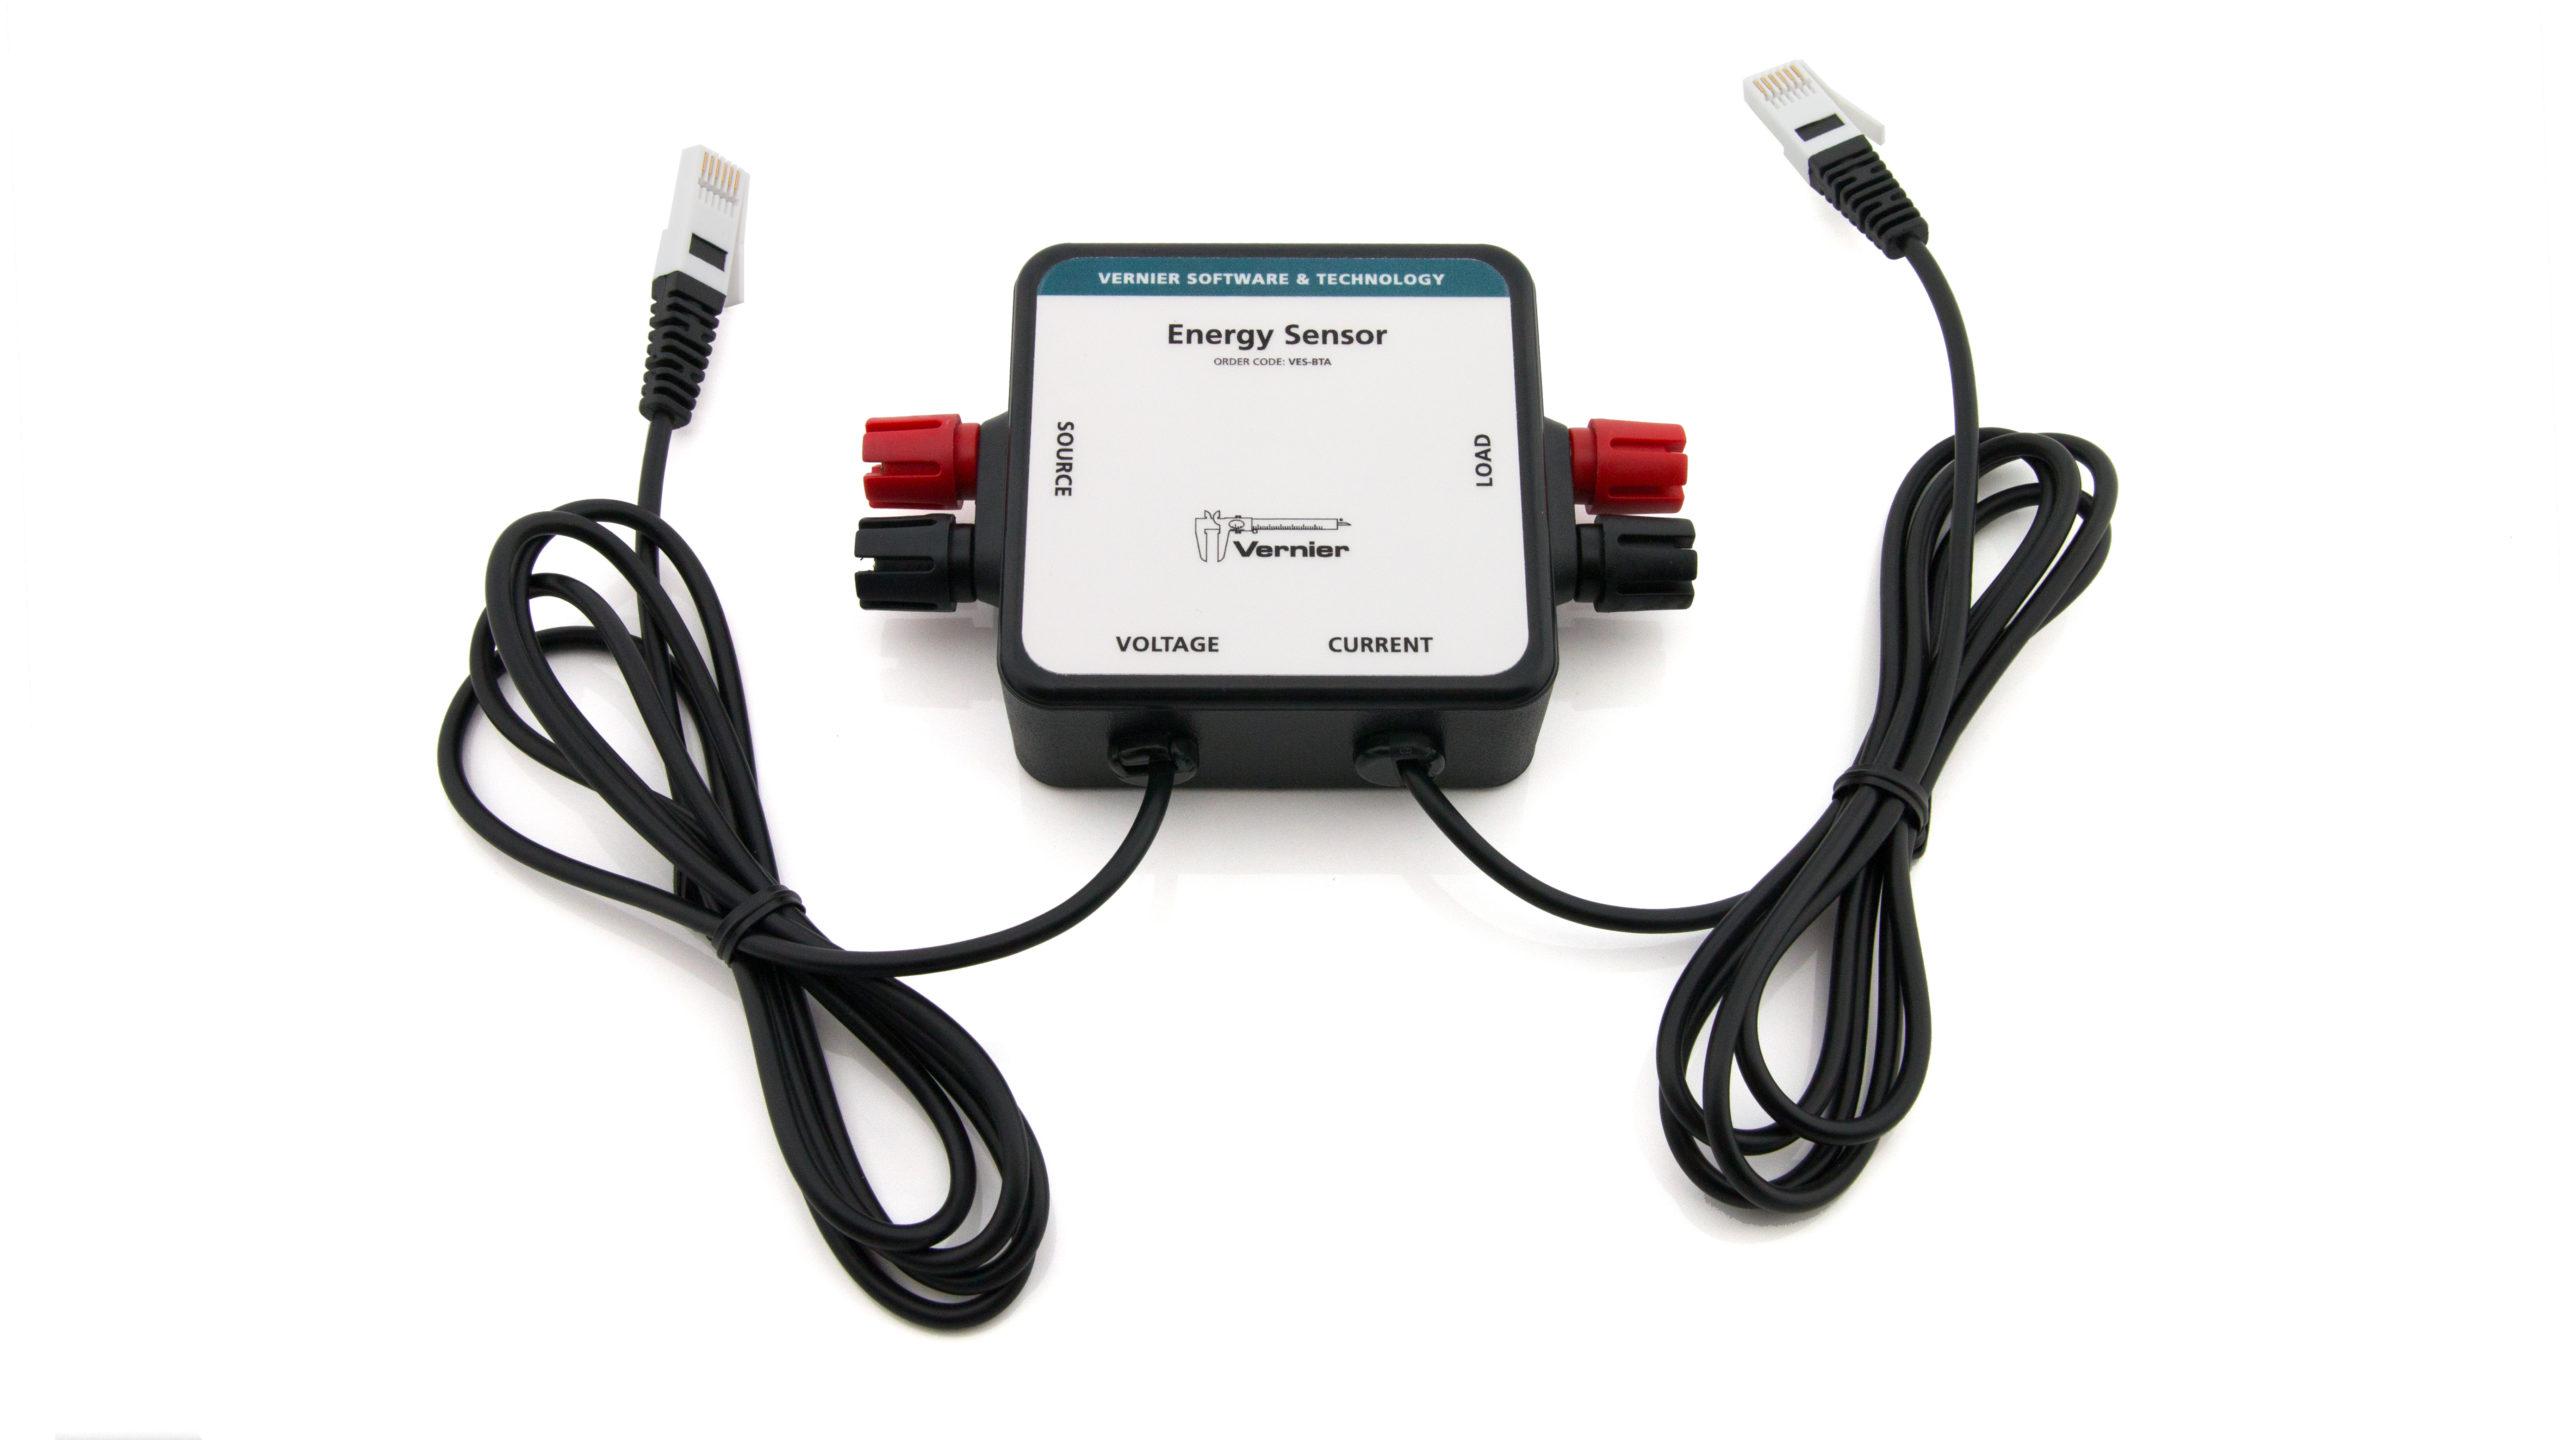
This experiment features the following sensors and equipment. Additional equipment may be required.
Ready to Experiment?
Ask an Expert
Get answers to your questions about how to teach this experiment with our support team.
- Call toll-free: 888-837-6437
- Chat with Us
- Email support@vernier.com
Purchase the Lab Book
This experiment is #9 of Renewable Energy with Vernier. The experiment in the book includes student instructions as well as instructor information for set up, helpful hints, and sample graphs and data.

