Free Trial
Try Graphical Analysis Pro free for 30 days. Limit one trial per customer.
Students should request access through their instructor.

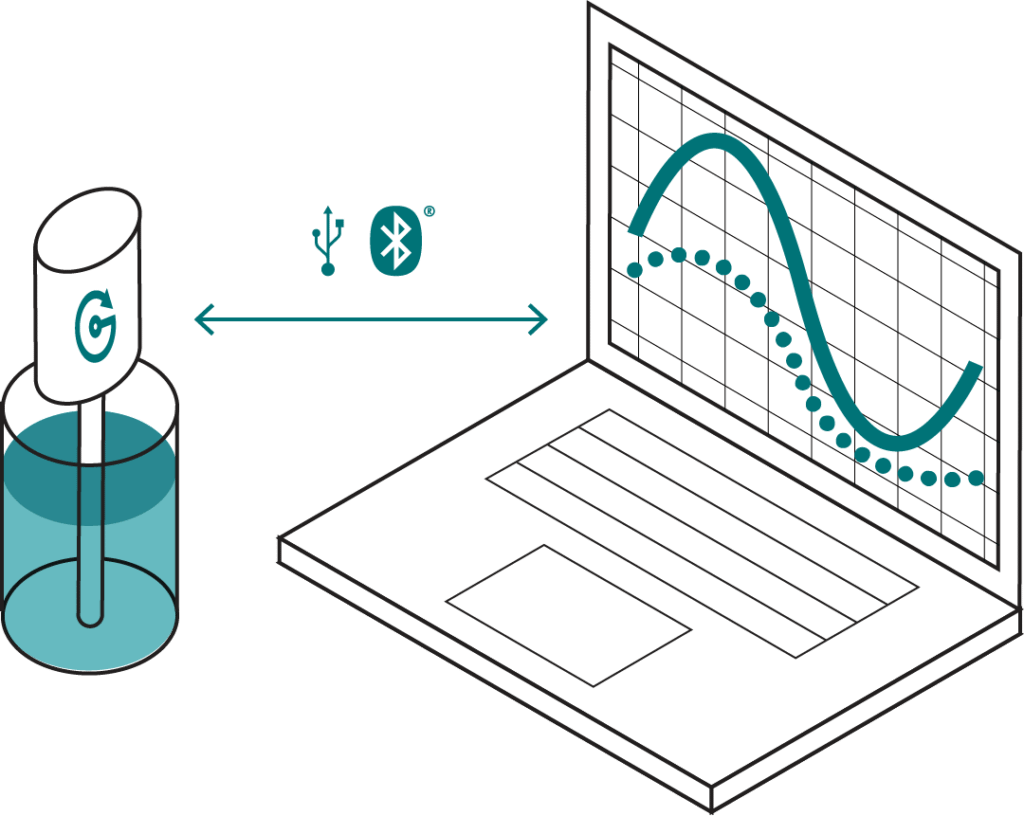
Help students form critical connections between abstract scientific ideas and the real world. With the Graphical Analysis app, students can visualize and interact with experiment data collected via nearly any Vernier sensor.
| BASIC | PRO | |
|---|---|---|
| Connect |
| |
| Collect | Enables data collection from multiple Go Direct® or LabQuest® sensors simultaneously | |
| Graph | Access to essential graphing options | Access to more graph types, including bar graphs, histograms, and FFTs |
| Analyze | Basic data analysis, including statistics and select curve fits | Advanced data analysis
And more! |
| Share | Not available | Share collected data from device to device in an instant |
| Extend | Not available | Library of over 45 investigations, which include lab instructions, experiment videos, and real data ready for student analysis
|
| Price | $0 Download | From $149 – 1 year site license (unlimited seats) Learn More |
Setup is quick, easy, and streamlined. Just download Graphical Analysis, connect to your Vernier sensor, and start collecting experiment data in seconds! Since Graphical Analysis works on all operating systems commonly found in today’s classrooms, students can use it anywhere and on nearly any device.
Want to enable advanced data analysis, better support remote learners, and enhance the learning experience? Complete your purchase to unlock Pro features at any time.
Increase student engagement during live demonstrations by sharing your experiment data with students’ personal devices—great for in-person and remote learning!
Have students demonstrate their comprehension of a graph—and the underlying scientific concepts—by marking peaks, troughs, slopes, inflection points, and other key features on the graph.
Create bar graphs, histograms, and FFTs. Plus, generate user-defined curve fits, understand the reliability of fitted parameters, use error bars to describe measurement uncertainty, strikethrough unwanted data, plot categorical items, and more for advanced data analysis.
Increase comprehension by giving students the ability to replay, speed up, slow down, and pause recorded experiments, crystallizing the connection between what they see and the data they record.
Gain access to a library of over 45 sample experiments—each with step-by-step instructions, a video of the experiment, and actual data collected in the video. In addition to helping you deepen students’ understanding of a scientific concept, the experiment library can be used to build schema before a lab; analyze real data when the needed lab equipment is unavailable; and provide opportunities for prep work, homework, or makeup assignments.
A subscription site license to Graphical Analysis Pro provides all students and educators at your K–12 school or college department with unlimited access to our award-winning app. Purchase a three-year subscription and save $148!
Exploring options for multi-site or district-wide access? Share a few details with us, and we’ll connect you with the right support.
Due to recent changes in U.S. trade policy, new tariffs are being implemented that impact our products. This means a surcharge of 5% will be applied to orders received starting May 12th, with the exception of software and books. Learn more.
Try Graphical Analysis Pro free for 30 days. Limit one trial per customer.
Students should request access through their instructor.
Graphical Analysis Pro is distributed as a subscription site license, which permits use of the app on any device under your K–12 school or college department’s control—as well as access to the app by any of the school’s staff/faculty members and students, who may also use the app on their personal devices.
Site licenses are available for different durations, depending on your purchase. Your subscription starts the day you activate the license.
Access to Graphical Analysis Pro may not be granted to individuals outside of the school.
We offer K–12 district licenses (minimum of five schools). Get pricing for your district by requesting a quote.
Vernier Graphical Analysis® version 6.2.0 is now available. Users will be prompted to update to the latest version directly in the app. These new features are also available in the Chrome™ browser-based version of the app: https://graphicalanalysis.app/.
Version 6.2.0
Released July 1, 2025
New Features for Graphical Analysis
New Features for Graphical Analysis Pro
Fixed Issues
Science education is our passion. Every one of our Tech Support team members has a degree in science—and the majority are former science teachers! They are uniquely qualified to help you with everything from deciding which Vernier tools would be most appropriate for your curriculum to quickly troubleshooting a technical issue in the middle of class.
Vernier Graphical Analysis Support
User Guide
FAQs & Troubleshooting Tips
Educator Success Stories
Email: support@vernier.com
Toll-free: 1-888-837-6437
Educational use only: Vernier products are designed for educational use. They are not appropriate for industrial, medical, or commercial applications.