When we originally created the popular Periodic Table application in LabQuest, we realized that there was a gold mine of information in the database that could eventually be used to create periodic table plots, such as atomic radius vs. atomic number, first ionization energy vs. atomic number, etc. Most introductory chemistry courses introduce periodic trends by having students create these kinds of plots and look for recurring trends in many chemical and physical properties. You can do this in LabQuest App.
- First, you need to update your LabQuest to version 1.4. Download free LabQuest update »
- After the unit is updated, turn on LabQuest without a sensor connected.
-
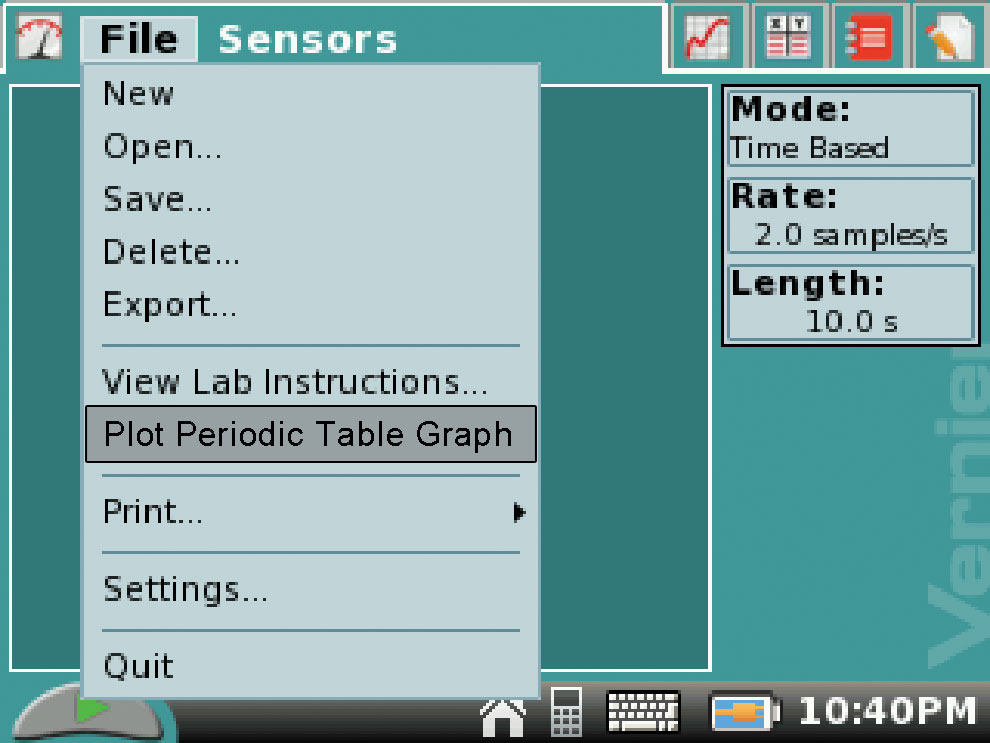
From the File menu, choose Plot Periodic Table Graph.

-
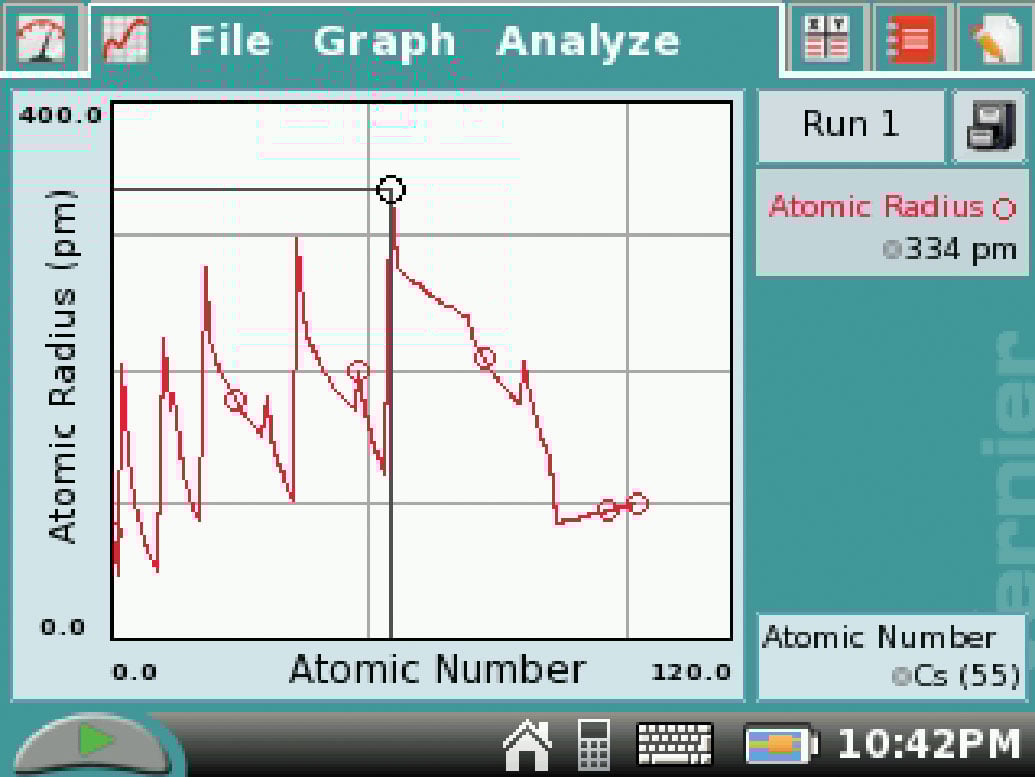
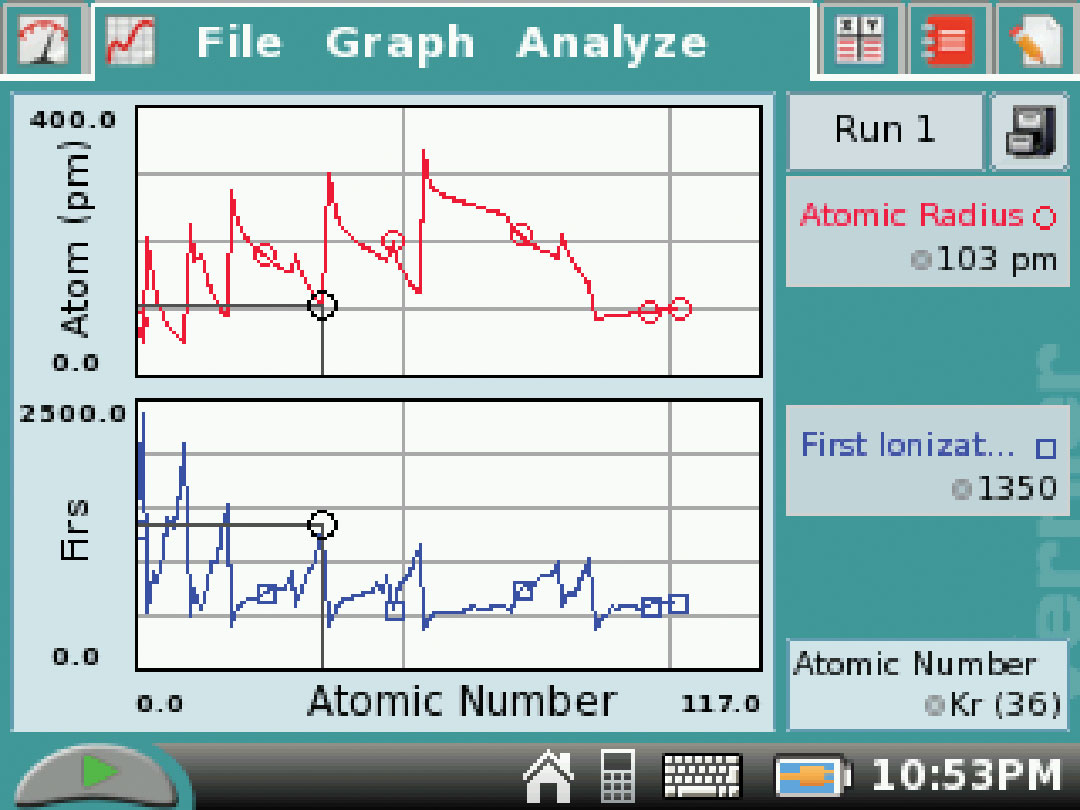
You will now be viewing a plot of Atomic Radius (pm) vs. Atomic Number, as shown here. Notice, too, that when you tap on any point along the curve, such as shown here for Cesium (Cs), that its atomic radius value and symbol/atomic number are shown in the info boxes to the right of the graph. This way, students can easily navigate through the periodic table, and observe that elements with similar properties recur at regular intervals.
-
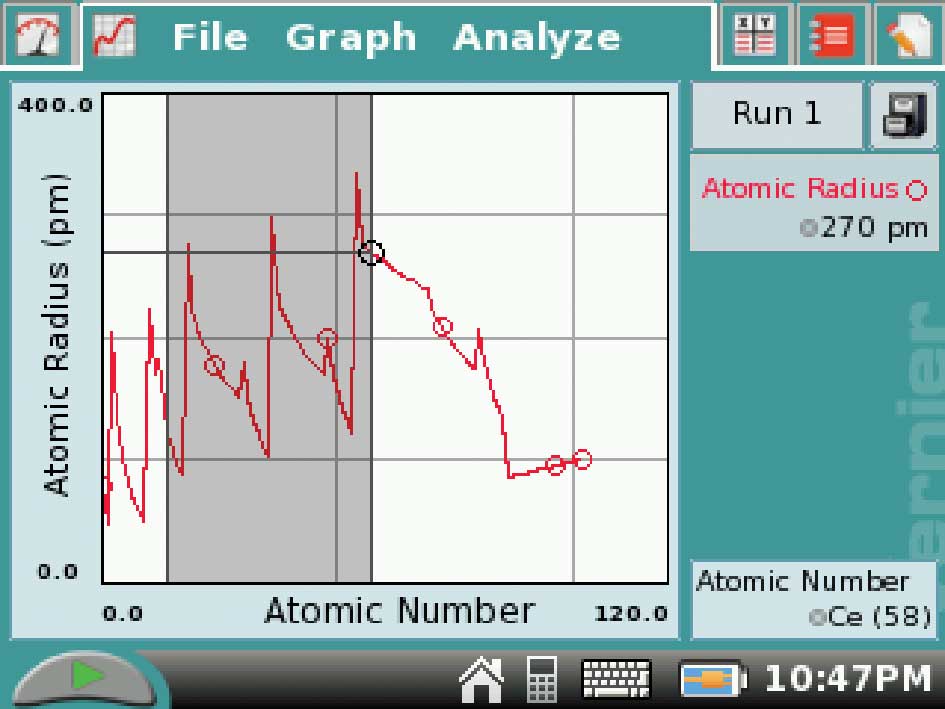
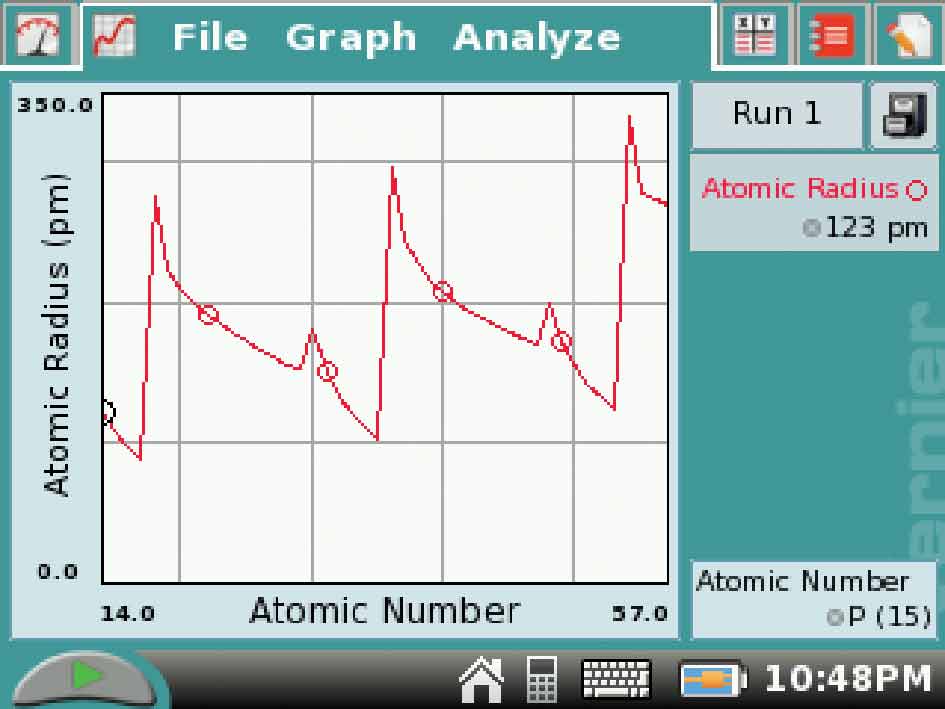
If you want to see additional detail, you can simply drag your stylus from left to right or right to left across the area of interest, and then choose Zoom from the Graph menu.
- To change to another plot, all you need to do is tap on the y-axis label, and choose one of the other quantities, such as Melting Point, Boiling Point, Density, Electronegativity, or First Ionization Energy.
-
Of course, LabQuest App has other graphing features that allow you to plot two different properties on two graphs (choose Show Graph g All Graphs from the Graph menu) or to plot more than one property on a single graph (choose Graph Options from the Graph menu, then in Run 1, check the boxes for any properties you wish to plot).
That’s all there is to it. We think you and your students will enjoy incorporating this useful tool into a periodic table discovery exercise. Don’t forget, too, that they can easily print paper copies of various graphs using USB-direct or wireless printing.