Sharing ideas and inspiration for engagement, inclusion, and excellence in STEM
The first week of school is a great time to lean into student curiosity, help everyone get comfortable with your lab routines and tools, and build students’ confidence with Vernier sensors and software. Whether you teach middle school science, high school science, or introductory college courses, the goal is the same: Empower students to use real-time data to make sense of the world.
These three hands-on activities are low prep, low stakes, and high impact. They introduce essential science and engineering practices, reinforce NGSS-aligned instruction, and get students comfortable using Vernier Go Direct® sensors and the Vernier Graphical Analysis® app.
Each activity is flexible and scalable—easily adapted for younger learners or more advanced classes with simple extensions or tweaks.
1. Temperature Change: How Fast Does Water Heat or Cool?
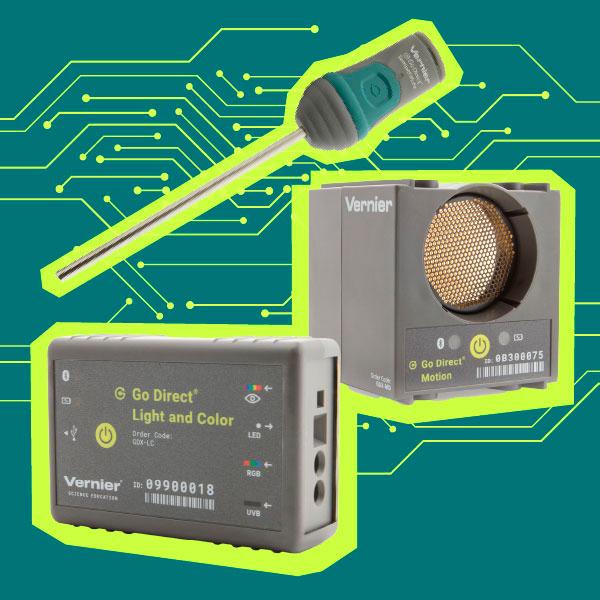
Sensor: Go Direct Temperature Probe
Phenomenon: Why do some containers keep drinks hot or cold longer?
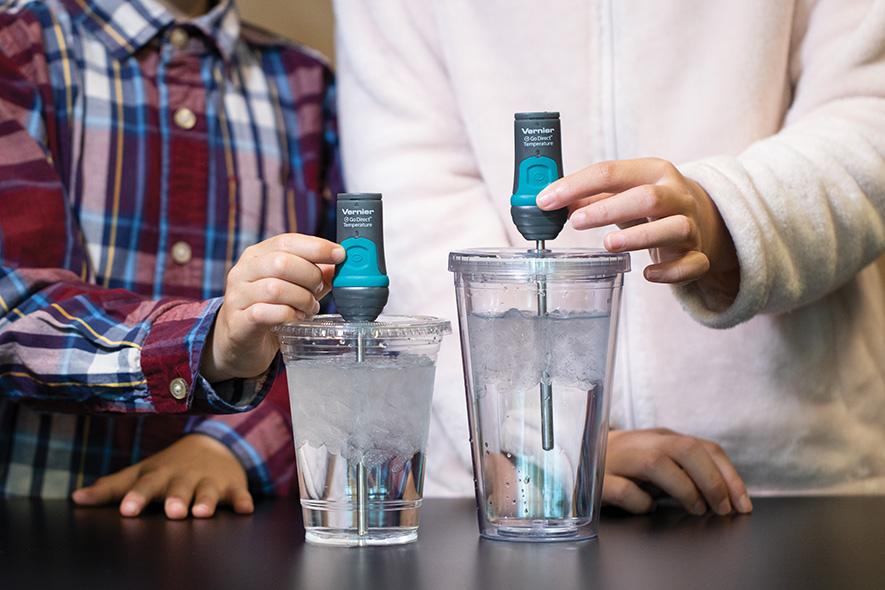
This activity introduces students to sensor-based data collection in a simple, tactile, and highly visual way. Students track how temperature changes over time—starting with warm or cold water and observing how it stabilizes, cools, or warms under different conditions.
You don’t need anything fancy: A few cups, tap water, and a temperature probe are enough to generate clear, compelling graphs. Students see temperature change in real time and learn to interpret those trends in context. It’s also a good chance to introduce safe lab habits and basic digital tool routines. If you have more time, you can experiment with introducing ice, hair dryers, foil, or other variables to affect temperature change.
What Students Practice
- Building familiarity with data-collection sensors and apps
- Using key tools in the Graphical Analysis app
- Collecting and analyzing data in real time
- Recognizing patterns and describing trends and rates of change
- Planning and carrying out investigations
- Making predictions
Suggested Activity Structure
- Introduce the sensor: Show how to launch Graphical Analysis and connect the Go Direct Temperature Probe. Give them a few minutes to explore the sensor and the app.
- Warm and cold water test: Have students take measurements of hot and cold tap water over time. Discuss what changes and why.
- Compare materials or scenarios: Compare a mug versus a foam cup, or add hands to warm the sensor. Ask: What changes the rate of heat loss or gain? Have students predict what the graph will look like with different cup materials.
- Optional challenge: Can students draw a letter “M” or “W” in the graph by switching between warm and cold? This helps students reinforce data visualization and modeling skills.
Scaling Ideas and Structured Experiments
- Elementary/Middle School: Focus on observation—what gets warmer faster or holds heat longer? Keep the activity focused on describing what students see.
Experiment Idea: Hold Everything! Comparing Insulators or A Hot Hand - High School/College: Quantify rates of change using slopes, discuss thermal conductivity, or apply energy transfer principles.
Experiment Idea: Intro to Data Collection or An Insulated Cola Bottle
Tip: Get even more ideas for using your temperature probe.
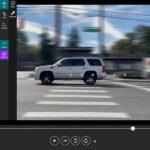
2. Match the Graph: What Kind of Motion Makes This Line?
Sensor: Go Direct Motion Detector
Phenomenon: Can you move in a way that creates a specific graph?
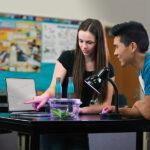
This is one of those activities that’s both simple to set up and surprisingly engaging for students. It’s a great option for the first week of school—students are moving, laughing, and experimenting, while you introduce key science practices, like modeling, and get students comfortable with data-collection tools in a low‑pressure setting.
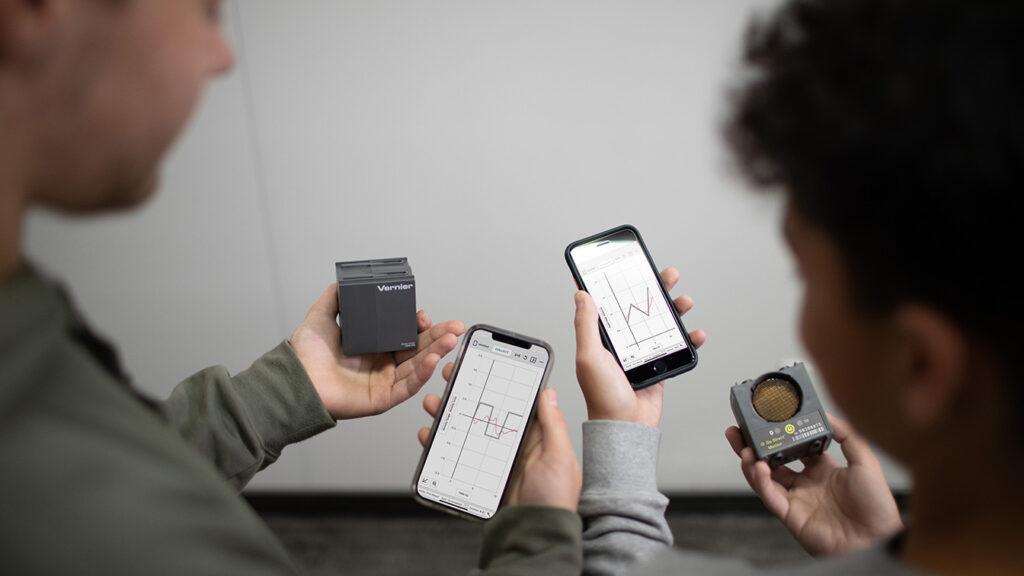
Students try to match a displayed graph by walking toward or away from the motion detector. Graphical Analysis shows live feedback, making the relationship between real-world motion and data visualization instantly clear.
What Students Practice
- Building familiarity with data-collection sensors and apps
- Connecting physical motion to graphical models
- Interpreting slope and direction in position-time graphs
- Making and testing predictions using real-time feedback
- Developing and using models
Suggested Activity Structure
- Introduce the sensor: Show students how to launch Graphical Analysis and connect the Go Direct Motion Detector. Give them a few minutes to explore the sensor and the app.
- Graph match challenge: Have students generate the Graph Match and then move to match the displayed graph. You can run this in two ways:
- Table setup: Set the sensor on a table and have students walk while holding a visible target (such as a binder or notebook). Best for USB connections or when using Graphical Analysis on a computer or laptop.
- Wireless setup: Have students hold the sensor and walk back and forth toward a plain wall. Best for wireless connections when using Graphical Analysis on a mobile device.
- Discussion and feedback: After each attempt, prompt students to reflect on what changed between runs and why. Discuss positive vs. negative slope, what might cause “fuzzy” data, and best practices for cleaner measurements.
- Make it fun: Turn it into a contest for smoothest line, most accurate match, or most creative motion pattern.
Scaling Ideas and Structured Experiments
- Elementary/Middle School: Keep it simple. Have students watch how their movement changes the graph and describe what they see. Focus on observation, cause-and-effect, and the “story” of the line rather than calculations.
Experiment Idea: Graphing Your Motion - High School/College: Use the same setup but add prediction and quantitative analysis. Challenge students to match a target graph, calculate slope as velocity, and connect their motion to kinematics concepts.
Experiment Idea: Graph Matching
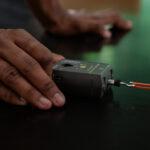
3. Light and Filters: How Do Materials Interact with Light?
Sensor: Go Direct Light and Color Sensor
Phenomenon: Why do some objects appear brighter or darker under different lighting or filters?
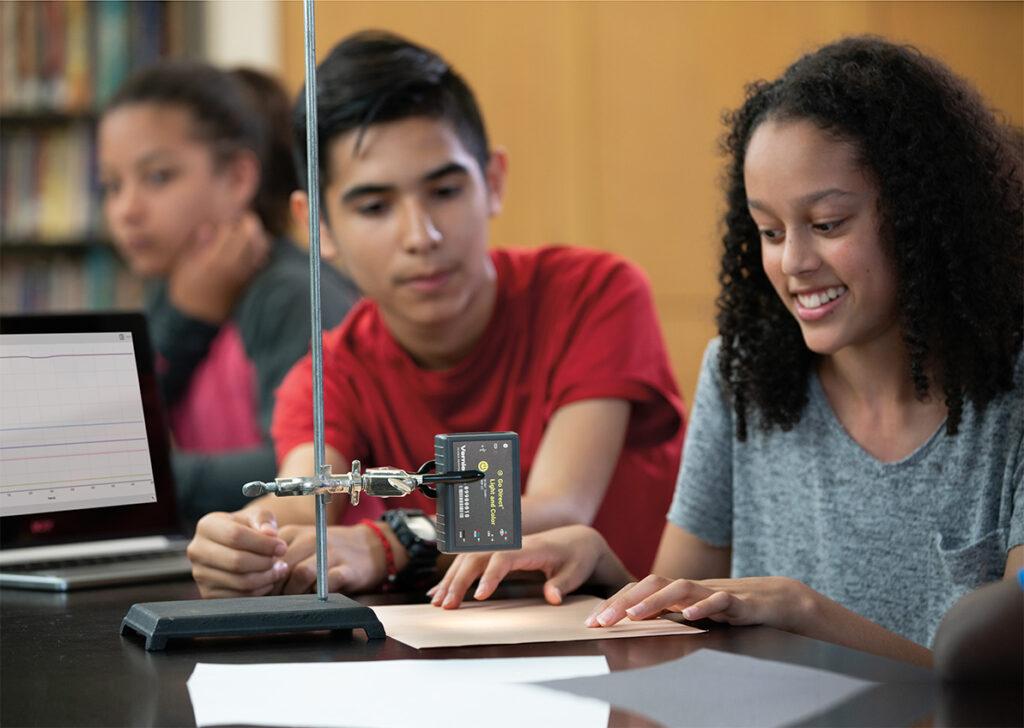
This is an easy, visual way to get students exploring light behavior while practicing with a new sensor. Students measure how much light reflects off of different materials—colored filters, construction paper, transparent plastic, cloth, or even autumn leaves—and then compare the results. This activity is open-ended and adaptable, so students can decide what to test, make predictions, and then check their ideas with real data.
Because it’s so visual and immediate, this makes a great first-week station or partner activity. Students can jump in without a lot of background knowledge and still make meaningful observations about patterns in the data. As they test, they naturally begin asking better questions: Why did the red filter block more light than expected? Why does white paper reflect more light than black paper?
What Students Practice
- Building familiarity with data-collection sensors and apps
- Recording and interpreting light intensity and color data
- Identifying and explaining observable patterns
- Analyzing and interpreting data
- Making claims backed by evidence
Suggested Activity Structure
- Make predictions: Show students the materials they’ll test. Have them rank which will reflect the most light and which will absorb the most.
- Introduce the sensor: Demonstrate how to connect the Go Direct Light and Color Sensor to Graphical Analysis. Show how to view intensity or RGB values in real time.
- Test and compare: Students measure light reflecting from each material and compare their results to their predictions. Encourage them to record differences and look for patterns.
- Discuss and connect: Talk about why certain colors or materials behave differently and connect students’ findings to real-world examples (sunglasses, greenhouse covers, plant leaves, etc.).
Tip: This activity works well as a short, student-led rotation. Students can easily test multiple materials in 10–15 minutes, then share results with the class. If you want to tie it to other first‑week activities, compare results with surface temperature readings from a temperature probe for a quick intro to multi-sensor investigations.
Scaling Ideas and Structured Experiments
- Elementary/Middle School: Keep it qualitative—focus on comparing light/dark and talking about transparency, translucence, and opacity.
Experiment Idea: Reflectivity of Light - High School/College: Introduce the idea of absorption and reflection, link results to color theory or photosynthesis, and graph intensity across materials.
Experiment Idea: Reflection and Absorption of Light
What’s your favorite sensor activity to start the new school year with? Share with us on social! Questions about Vernier technology? Reach out to our team at support@vernier.com, call
(888)-837-6437, or drop us a line in the live chat.
Share this Article
Related Articles


Sign up for our newsletter
Stay in the loop! Beyond Measure delivers monthly updates on the latest news, ideas, and STEM resources from Vernier.