Sharing ideas and inspiration for engagement, inclusion, and excellence in STEM
While Beer’s law might be the most common experiment that comes to mind when thinking about spectrometers, spectroscopy is fundamental throughout the first year of chemistry! And because it’s such a powerful tool for teaching chemistry fundamentals, it’s important in nearly every level of chemistry onwards. There are many hands-on activities your students can do with spectrometers, such as the Go Direct® SpectroVis® Plus Spectrophotometer, that illuminate important scientific principles—atomic theory, electron structure, periodic table trends, stoichiometry, mole theory, and more. In this blog post, we are sharing two hands-on spectroscopy experiments that you can use to explore principles of light with your students.
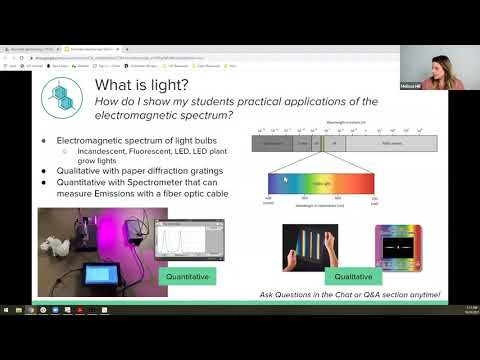
1. Explore the Electromagnetic Spectrum with Light Bulbs
Introducing the study of light in chemistry often involves qualitative demonstrations of the electromagnetic spectrum. For example, the use of diffraction gratings to visually demonstrate the color spectrum of white light can be fun and engaging for students. But why not make that exercise quantitative?
With the Go Direct SpectroVis Plus, your students can dig deeper into the science behind light diffraction and investigate the numbers behind the visual phenomenon. One easy way to do this is to use your spectrometer to collect spectral data from different types of light bulbs.
Essentials for this experiment
- Go Direct SpectroVis Plus (or other spectrometer)
- Various light bulbs (i.e., incandescent, fluorescent, LED, or grow lamp)
- LabQuest interface or Vernier Spectral Analysis® app on any supported device
- Vernier Spectrophotometer Optical Fiber
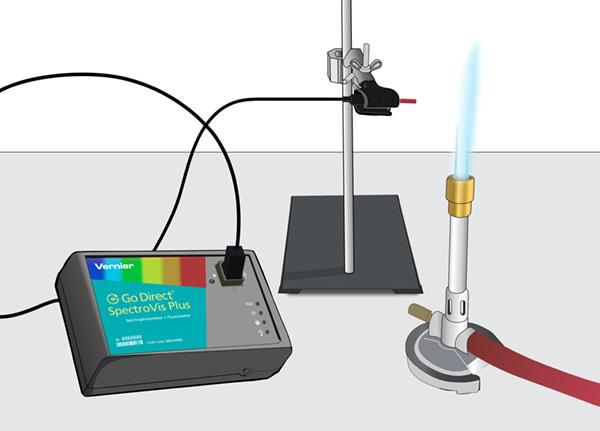
If you’re using a LabQuest interface, connect the spectrometer to it by USB cable and change the spectrometer mode to intensity. If you’re using a laptop, Chromebook™, tablet, or other device, connect the spectrometer via Bluetooth® or USB and launch our free software Vernier Spectral Analysis. Select the Emissions vs. Wavelength experiment. Once your software is ready, insert the optical fiber cable into the spectrometer cuvette slot, and use a clamp to hold the cable tip steady, facing your light source.
With the first light bulb powered and steady, you can begin collecting emission spectra data. As you change out each type of light bulb and collect data, observe and record the different peaks in the spectrum. Then compare, contrast, and analyze the results with your students.
To engage students in real-world applications, you can open up a discussion about the evolution of chemicals used in commercial light bulbs over time, from mercury to incandescent to LED, or even connect it to the biological concepts of chlorophyll and grow lamps.
Tips
- Because light bulbs are extremely bright, reduce the sample time to 10 ms.
- Adjust the distance between your light source and the optical fiber tip to keep graph peaks in a visible range.
- Enhance visuals by turning on spectrum strips in the graph.
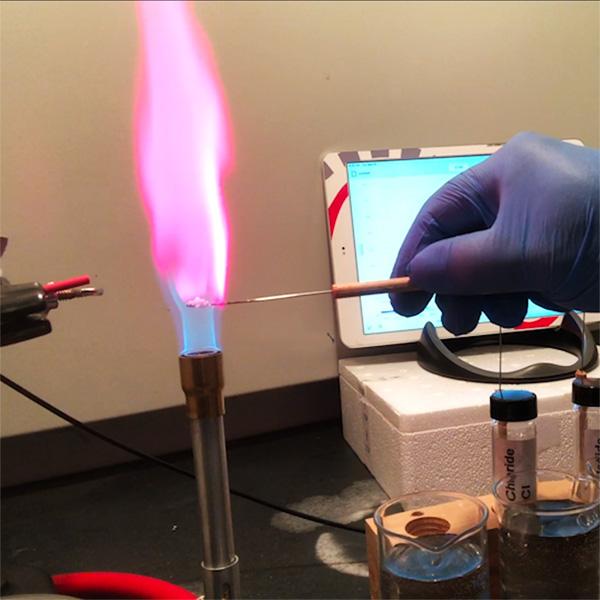
2. Use Flame Tests to Explore What Light Tells Us About Atoms
Moving beyond the basics of light, spectroscopy can be used to explore topics like atomic theory and electron movement. Not only are flame tests an effective way to do this, they’re also one of the most visually captivating experiments to perform with students. The range of vibrant colors and the thrill of open flames are a surefire way to keep the attention of your class. But again, you can make this a hands-on, quantitative experiment.
Essentials for this experiment
- Go Direct SpectroVis Plus (or other spectrometer)
- A variety of metal salt solutions (i.e., LiCl, NaCl, KI, CaCl2, H3BO3, Cu)
- LabQuest interface or Vernier Spectral Analysis app on any supported device
- Vernier Spectrophotometer Optical Fiber
- Bunsen burner
With the same setup as the light bulb experiment, you can set up the spectrometer and optical fiber cable to collect data from the different color flames that are produced by burning different known metal compounds.
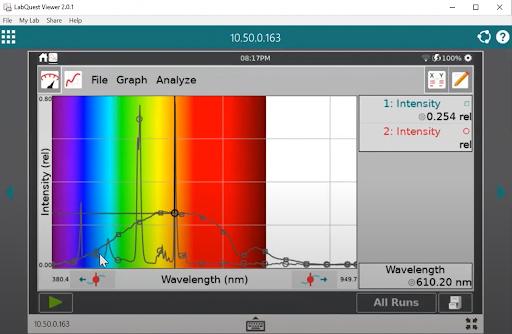
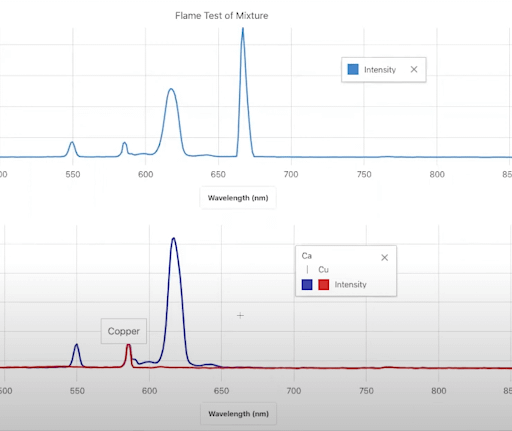
Carefully burn each compound and collect the full wavelength spectra using LabQuest or Spectral Analysis app. Label and store each collection run. After you’ve collected all your data, discuss with your students how each metal solution produces a distinct peak wavelength.
This experiment demonstrates to your students a key concept in atomic theory: each atom has a unique peak wavelength. This tells us that atoms are different from each other and interact with light differently—and that means that light can serve as a crucial investigative tool in examining atoms, molecules, and chemicals.
To connect this concept to real-world applications, engage your students in a forensic investigation into a fictional case of toxic metal poisoning! In this experiment, students use flame tests to identify the unknown metal in a poisoned sports drink by comparing emission spectra from known metals.
Tips
- Always employ rigorous safety measures when students are around flames.
- Keep a safe distance of about 3 or 4 cm between the flames and the cable to avoid heat damage.
- Use separate nichrome wires for each metal ion solution to help reduce contamination.
Looking for even more ideas on how to incorporate spectroscopy into your classes? Watch our webinar Illuminate Spectroscopy for even more ways to engage your students with Beer’s law and beyond.
Do you have questions about how to use your Vernier spectrometers? We’re here to help! Reach out to chemistry@vernier.com or call 888-837-6437.
Share this Article
Related Articles


Sign up for our newsletter
Stay in the loop! Beyond Measure delivers monthly updates on the latest news, ideas, and STEM resources from Vernier.