
Sharing ideas and inspiration for engagement, inclusion, and excellence in STEM

There are many ways to measure motion in your physics classes, from the classic meter stick and stopwatch method to photogates and sensor carts. But the Go Direct® Motion Detector is one of the most versatile, engaging tools you can leverage in your classroom. This sensor measures the position of moving objects by sending out an ultrasonic pulse (a sound wave at a frequency beyond human hearing) and using the echo from its target to calculate velocity and acceleration data.
Its wireless, compact design makes it easy to use in standalone motion experiments or to combine with other elements like carts and track systems or wall mounts. Ready to explore key motion concepts with your students? Here are three hands-on, 3D-aligned investigations using the Go Direct Motion Detector.
1. Graph Matching
Level: Middle School through College
Best for: Introducing students to graph analysis and basic motion concepts
Graph matching is one of the best ways to introduce students at any grade level to using motion detectors. It’s a fun activity to start the year—it gets students up and active, can be framed as a fun competition, and helps set the tone that physics isn’t something you learn by just sitting and listening. Graph matching emphasizes hands-on, student-led exploration as the core of physics learning.
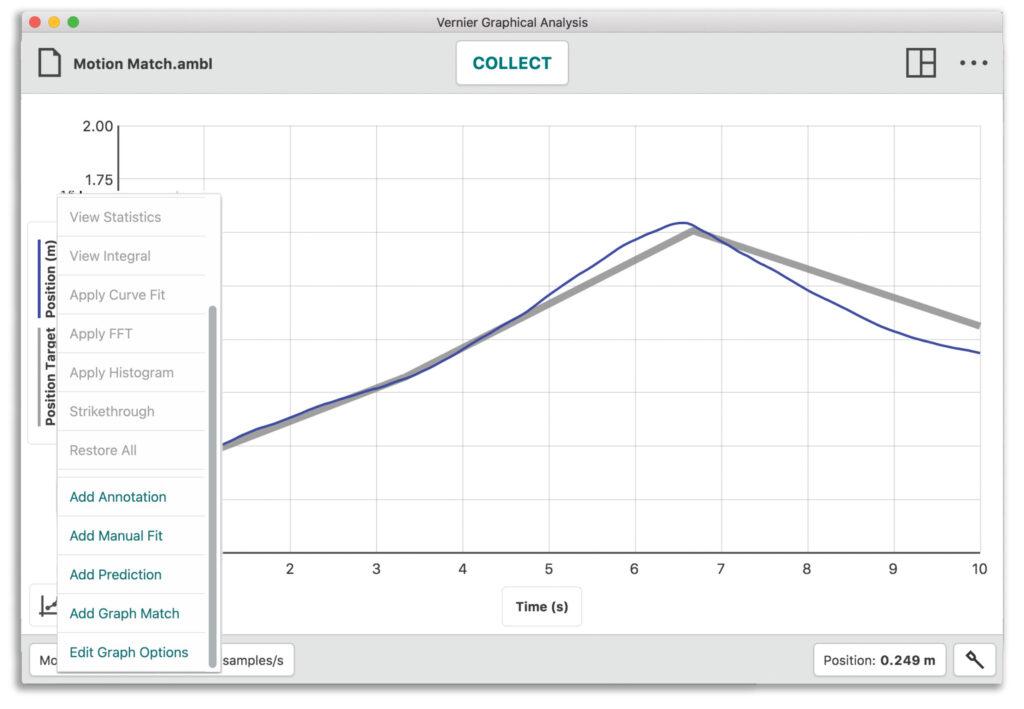
In this experiment, students use their bodies (as the moving object) and the motion detector to recreate and match a randomly generated graph in Vernier Graphical Analysis®. Unlike the old-school meter stick and stopwatch method, students can generate position vs. time graphs in real time, using their body movement as a way to “draw” the graphical representation. Not only is it useful for covering key kinematics concepts, but it also helps reinforce data and graph literacy across the board.

Tips
- For cleaner data, have students hold a whiteboard or binder as the motion target. If using a mobile device, they should aim at a clean wall with no obstacles in their path.
- Turn the experiment into a friendly competition to see who can match the graph most accurately.
Experiment Objectives
- Analyze the motion of a student walking across the room.
- Predict, sketch, and test position vs. time and velocity vs. time kinematics graphs.
- Improve students’ understanding of the relationship between physical motion and its graphical representation.
| 3D Elements in this Investigation | |
| Disciplinary Core Ideas | PS2A: Forces and Motion |
| Science and Engineering Practices | Analyzing & Interpreting Data |
| Crosscutting Concepts | Patterns Systems Cause and Effect |
2. Air Resistance
Level: High School and College
Best for: Understanding drag force, terminal velocity, and real-world kinematics
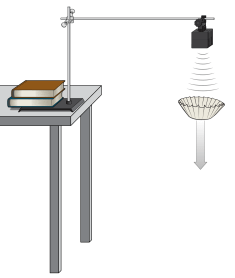
In many introductory physics problems, students are asked to ignore air resistance and assume acceleration is constant. However, in the real world, air resistance plays a significant role in the motion of falling objects. This hands-on investigation provides a great opportunity to show students how air resistance—or drag force—affects different objects.
By investigating with everyday materials like coffee filters, students can see how mass and shape influence an object’s terminal velocity. The motion detector allows students to collect real-time data as coffee filters or other objects fall, making abstract concepts like air resistance and gravitational acceleration more concrete.
Tips
- Use multiple coffee filters and vary the mass to emphasize the relationship between drag and terminal velocity.
- For best results, drop the filters from a height, such as from a stairwell or a standing position on a chair.
- Use the Go Direct Motion Detector’s Bluetooth® wireless connection to optimize sensor placement for better results.
Experiment Objectives
- Observe the effect of air resistance on falling objects.
- Determine how air resistance and mass affect the terminal velocity of a falling object.
- Analyze which drag force model (proportional to velocity or velocity squared) best fits the data.
| 3D Elements in this Investigation | |
| Disciplinary Core Ideas | PS2A: Forces and Motion PS2.B Types of Interactions |
| Science and Engineering Practices | Developing and Using Models Using Mathematics and Computational Thinking |
| Crosscutting Concepts | Systems and System Models Cause and Effect |
3. Energy of a Tossed Ball
Level: High School and College
Best for: Exploring energy conservation in motion
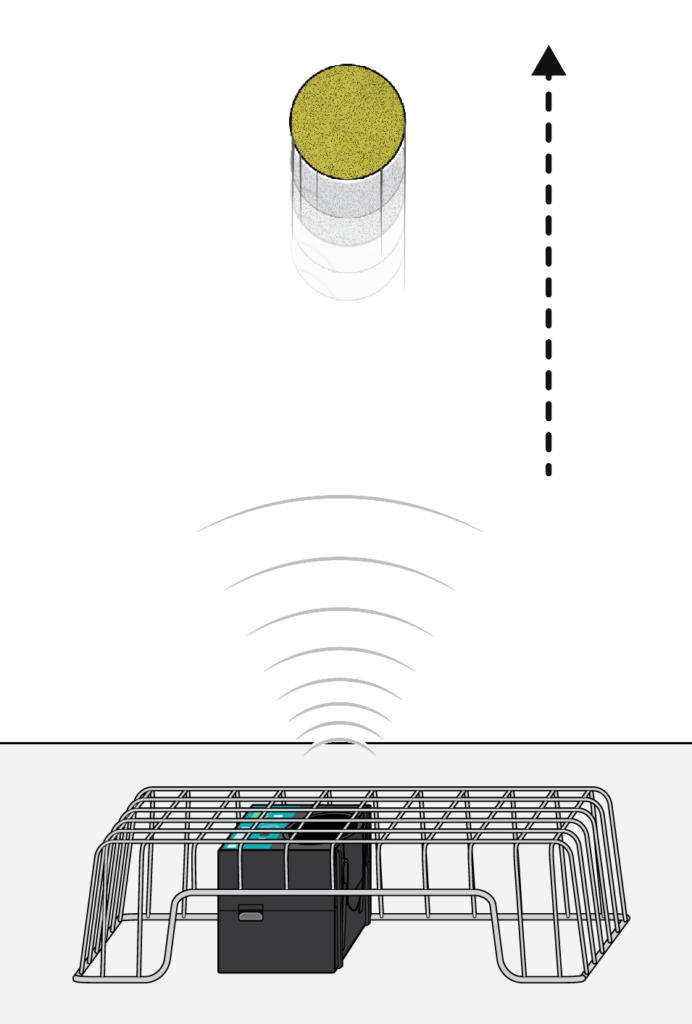
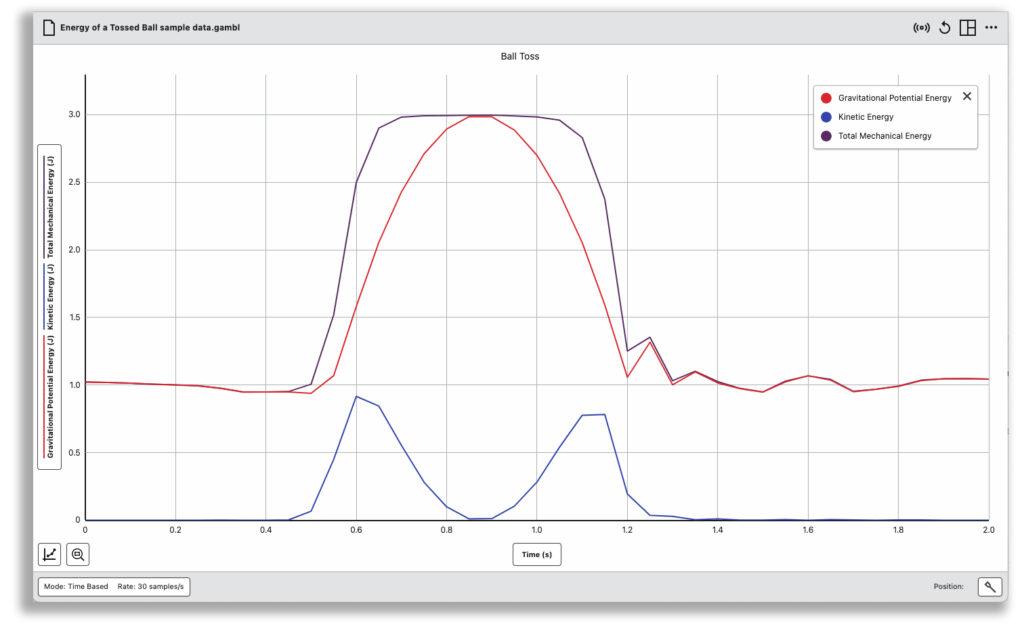
Building on foundational concepts from the experiments above, this experiment explores how energy transforms during free fall. When a ball is tossed into the air, it slows down as it rises, converting kinetic energy (KE) into gravitational potential energy (PE). On its descent, the reverse occurs—PE is converted back into KE. Through this experiment, students can visualize these energy transformations and explore the principle of energy conservation.
By using the Go Direct Motion Detector, students can measure changes in both kinetic and potential energy during the ball’s motion. This experiment is an excellent way to connect theoretical concepts to real-world motion and helps reinforce the conservation of mechanical energy.
Tips
- Introduce the Ball Toss experiment as a lead-up to this investigation on kinetic energy.
- Place a wire letter tray over the motion detector to protect the sensor from the falling ball.
- Use a heavier ball, such as a volleyball or basketball, to minimize the effects of air resistance during the main experiment. You can also introduce a lighter object, like a beach ball, as an optional extension to analyze air resistance.
- Practice tossing the ball with both hands on either side. Gently toss it upward and quickly move your hands out of the detector’s range for optimal data collection.
Experiment Objectives
- Measure the change in the kinetic and potential energies as a ball moves in free fall.
- See how the total energy of the ball changes during free fall.
| 3D Elements in this Investigation | |
| Disciplinary Core Ideas | PS2A: Forces and Motion PS3.A Definitions of Energy PS3.B Conservation of Energy and Energy Transfer |
| Science and Engineering Practices | Analyzing and Interpreting Data Using Mathematics and Computational Thinking Engaging in Argument From Evidence |
| Crosscutting Concepts | Patterns Energy and Matter |
Looking for more? Check out our Maximizing Motion: Getting to Know the Go Direct Motion Detector webinar to see Vernier physics specialist Josh Ence share even more ideas for using this sensor. You can also read our blog post on tips and best practices for reducing noise and getting the best motion data from your sensor.
Questions? We’re always here to help! Reach out to physics@vernier.com or call 888-837-6437.
Share this Article

Sign up for our newsletter
Stay in the loop! Beyond Measure delivers monthly updates on the latest news, ideas, and STEM resources from Vernier.


