Video Overview
Introduction
An electrocardiogram, or EKG, is a graphical recording of the electrical events occurring within the heart. A typical EKG tracing consists of five identifiable deflections. Each deflection is noted by one of the letters P, Q, R, S, or T. The P wave is the first waveform in a tracing and represents the depolarization of the heart’s atria. The next waveform is a complex and consists of the Q, R, and S deflection. The QRS complex represents the depolarization of the heart’s ventricles. The deflection that represents the repolarization of the atria is usually undetectable because of the intensity of the QRS waveform. The final waveform is the T wave and it represents the repolarization of the ventricles.
Because an EKG is a recording of the heart’s electrical events, it is valuable in diagnosing diseases or ailments that damage the conductive abilities of the heart muscle. When cardiac muscle cells are damaged or destroyed, they are no longer able to conduct the electrical impulses that flow through them. This causes the electrical signal to terminate at the damaged tissue or directed away from the signal flow. The termination or redirection of the electrical signal will alter the manner in which the heart contracts. A cardiologist can look at a patient’s electrocardiogram and determine the presence of damaged cardiac muscle based on the waveform as well as the time interval between electrical events.
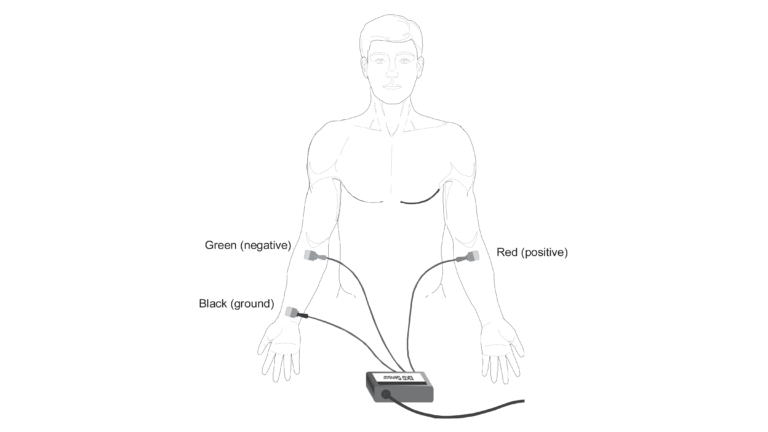
In this activity, you will use the EKG sensor to make a five-second graphical recording of your heart’s electrical events. From this recording, you will identify the previously mentioned waveform components and determine the time intervals associated with each.
Objectives
In this experiment, you will
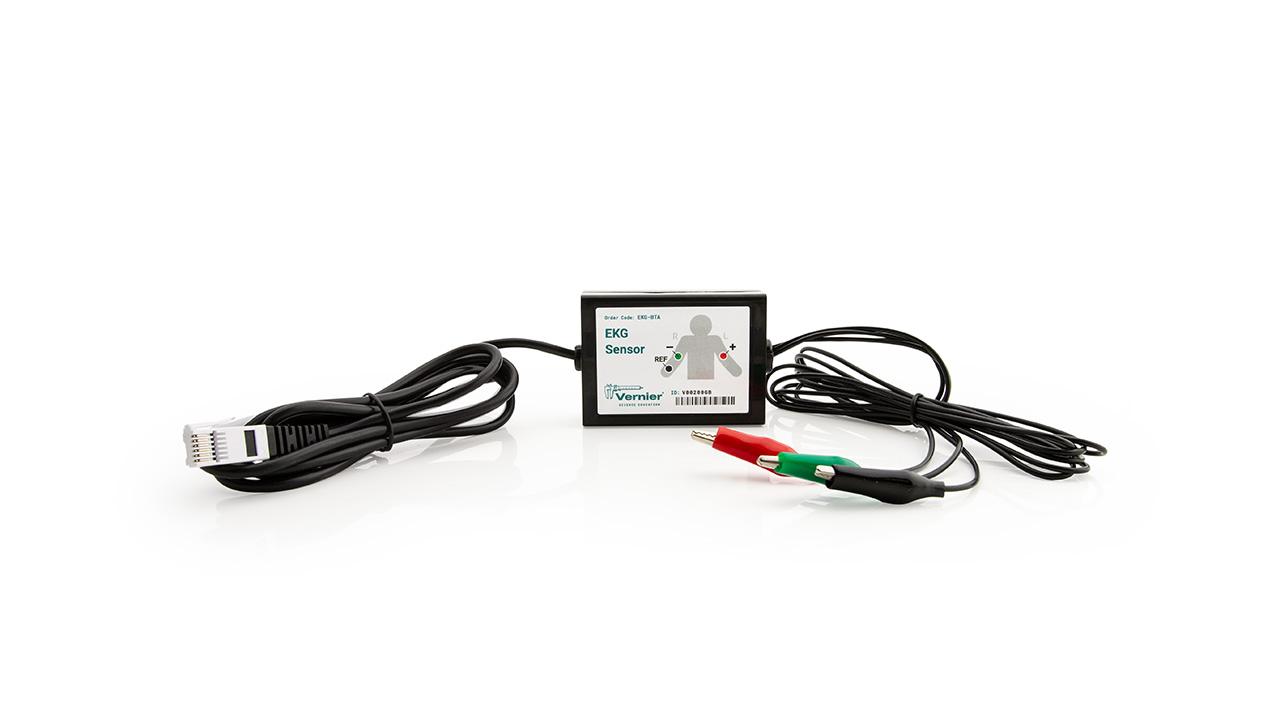
- Use the EKG Sensor to graph your heart’s electrical activity.
- Determine the time interval between EKG events.
- Calculate heart rate based on your EKG recording.
Sensors and Equipment
This experiment features the following sensors and equipment. Additional equipment may be required.
Option 1

Option 2
Correlations
Teaching to an educational standard? This experiment supports the standards below.
- International Baccalaureate (IB)/Sports, Exercise, and Health Science
- 2.2 Structure and function of the cardiovascular system
Ready to Experiment?
Ask an Expert
Get answers to your questions about how to teach this experiment with our support team.
- Call toll-free: 888-837-6437
- Chat with Us
- Email support@vernier.com
Purchase the Lab Book
This experiment is #28 of Biology with Vernier. The experiment in the book includes student instructions as well as instructor information for set up, helpful hints, and sample graphs and data.