The Mysterious Case of the Unusually Cool Beverage
Experiment #3 from Forensic Chemistry Experiments
- Subject
- Chemistry

Introduction
The suspicion is that the student with the allergic reaction may have used the wrong sweetener. One way to distinguish between the sweeteners is to determine the molar heat of solution, ∆Hsoln. This is the amount of heat energy required to dissolve a fixed amount of a chemical in water.
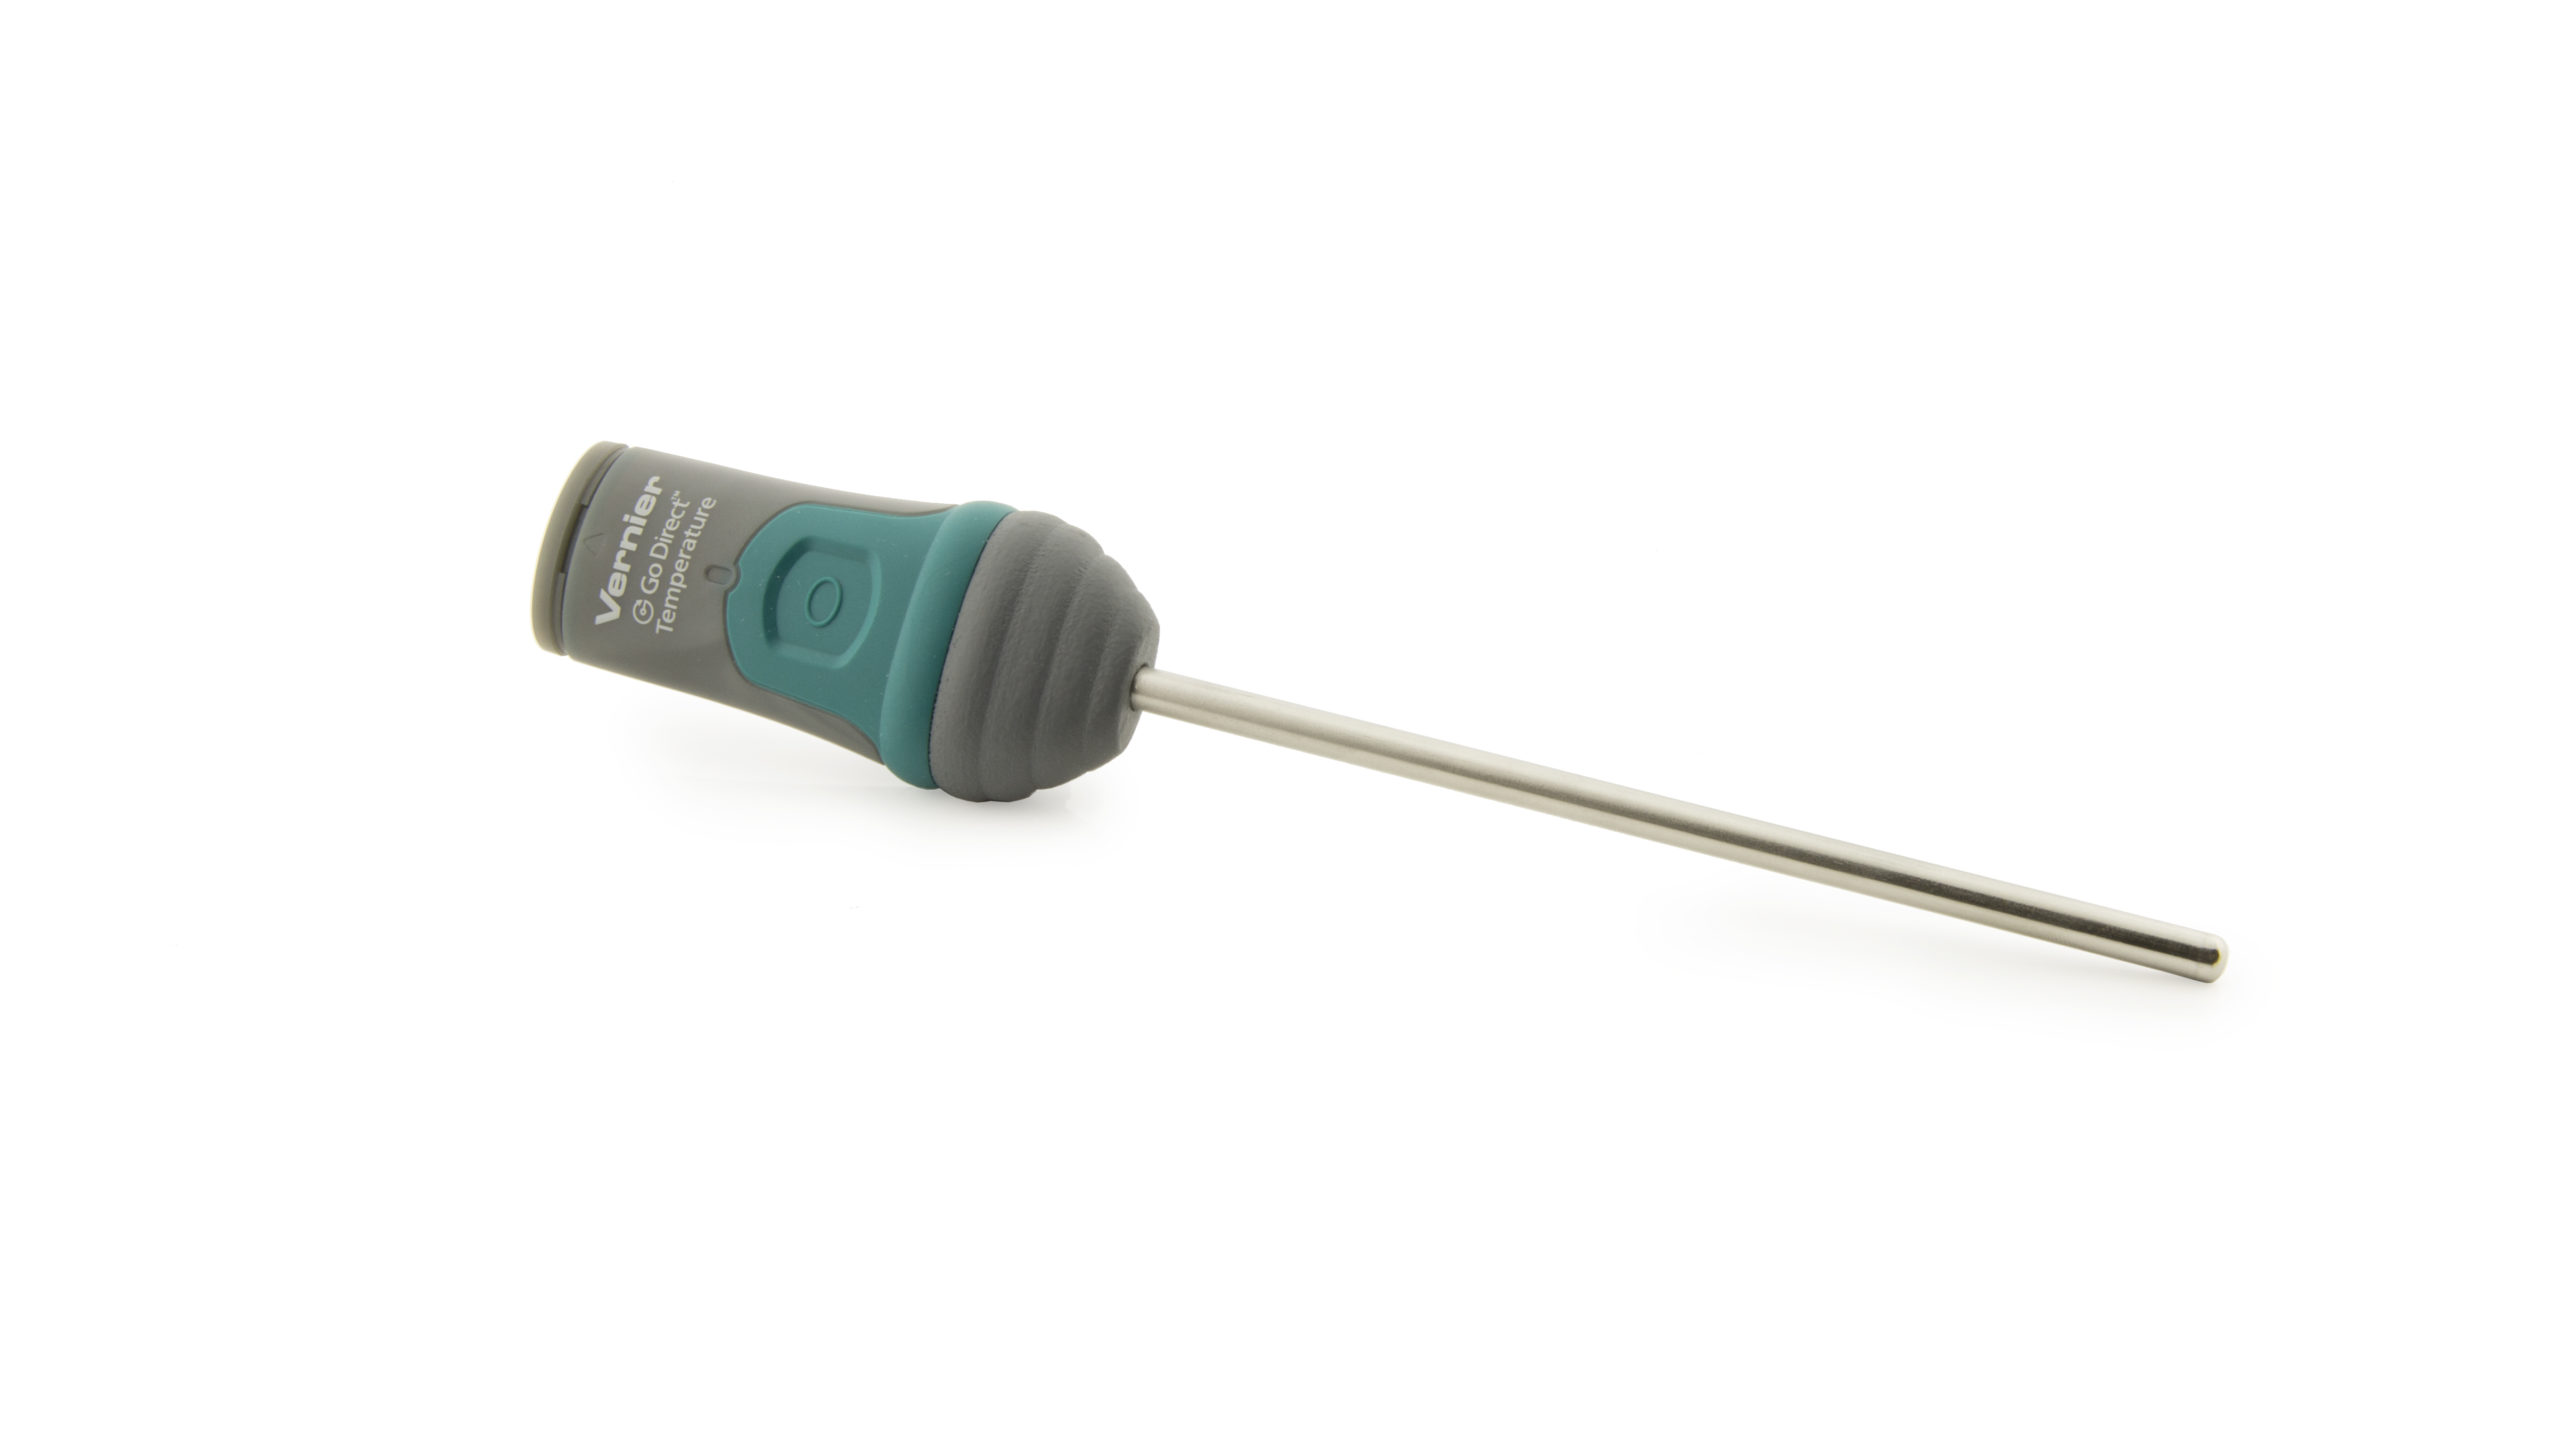
In this experiment, you will measure the temperature change as a measured amount of each sweetener is dissolved in water. From that data, you will calculate the amount of heat involved in the solution process.
To calculate the heat involved, you will use the following equation
q = mCpΔT
where q is the heat energy, m is the mass of the water, ∆T is the change in temperature, and Cp is the specific heat of water, 4.184 J/g°C. This means that 4.184 joules of energy are required to change the temperature of each gram of water by 1 degree Celsius.
Since the amount of heat involved depends on the amount of substance being dissolved, you will determine the heat of solution in kJ/mol for each sweetener.
You will compare the heat of solution for each substance with that of the sweetener sample recovered by the CSI team to determine which sweetener was used in the drink.
Objectives
- Determine and compare the heat of solution for four substances dissolved in water.
- Calculate the heat of solution in kJ/mol.
- Use your data and calculations to identify which sweetener was used by the victim.
Sensors and Equipment
This experiment features the following sensors and equipment. Additional equipment may be required.
Ready to Experiment?
Ask an Expert
Get answers to your questions about how to teach this experiment with our support team.
- Call toll-free: 888-837-6437
- Chat with Us
- Email support@vernier.com
Purchase the Lab Book
This experiment is #3 of Forensic Chemistry Experiments. The experiment in the book includes student instructions as well as instructor information for set up, helpful hints, and sample graphs and data.


