Introduction
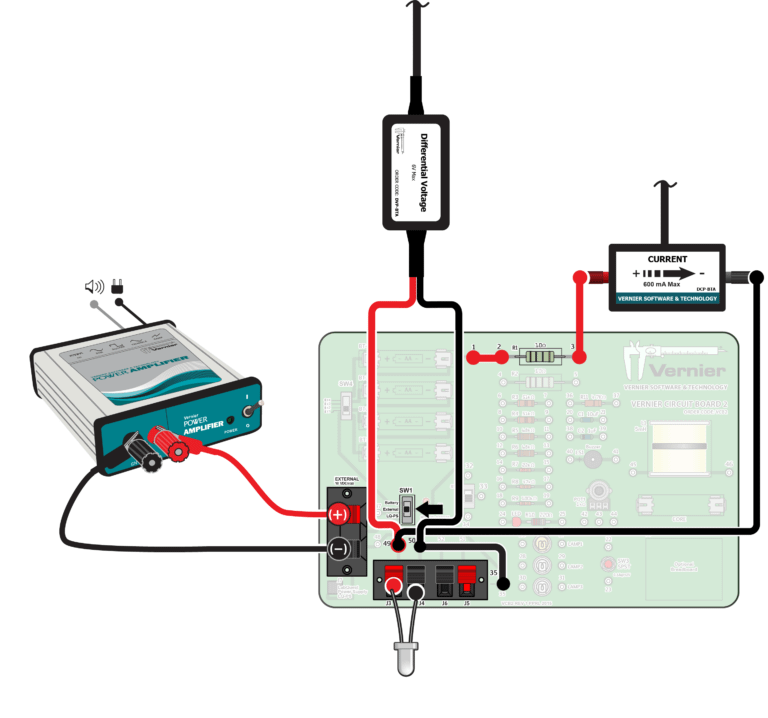
The energy of a photon is related to its frequency by the equation E = hf, where h is Planck’s constant. By determining the potential required to excite an LED to emit light, you can estimate the energy of the photons emitted. Using a spectrometer, you can measure the peak wavelength of the emitted light; from this, the frequency can be calculated. Performing this analysis for a number of LEDs will enable you to obtain a reasonable approximation of the value of Planck’s constant.
Objectives
In this experiment, you will
- Collect and analyze current vs. potential data to estimate the energy required to excite a number of LEDs.
- Use a spectrometer to determine the wavelength of the peak output of each LED.
- Determine a value for Planck’s constant from an analysis of the energy and frequency of the light emitted by a number of LEDs.
Sensors and Equipment
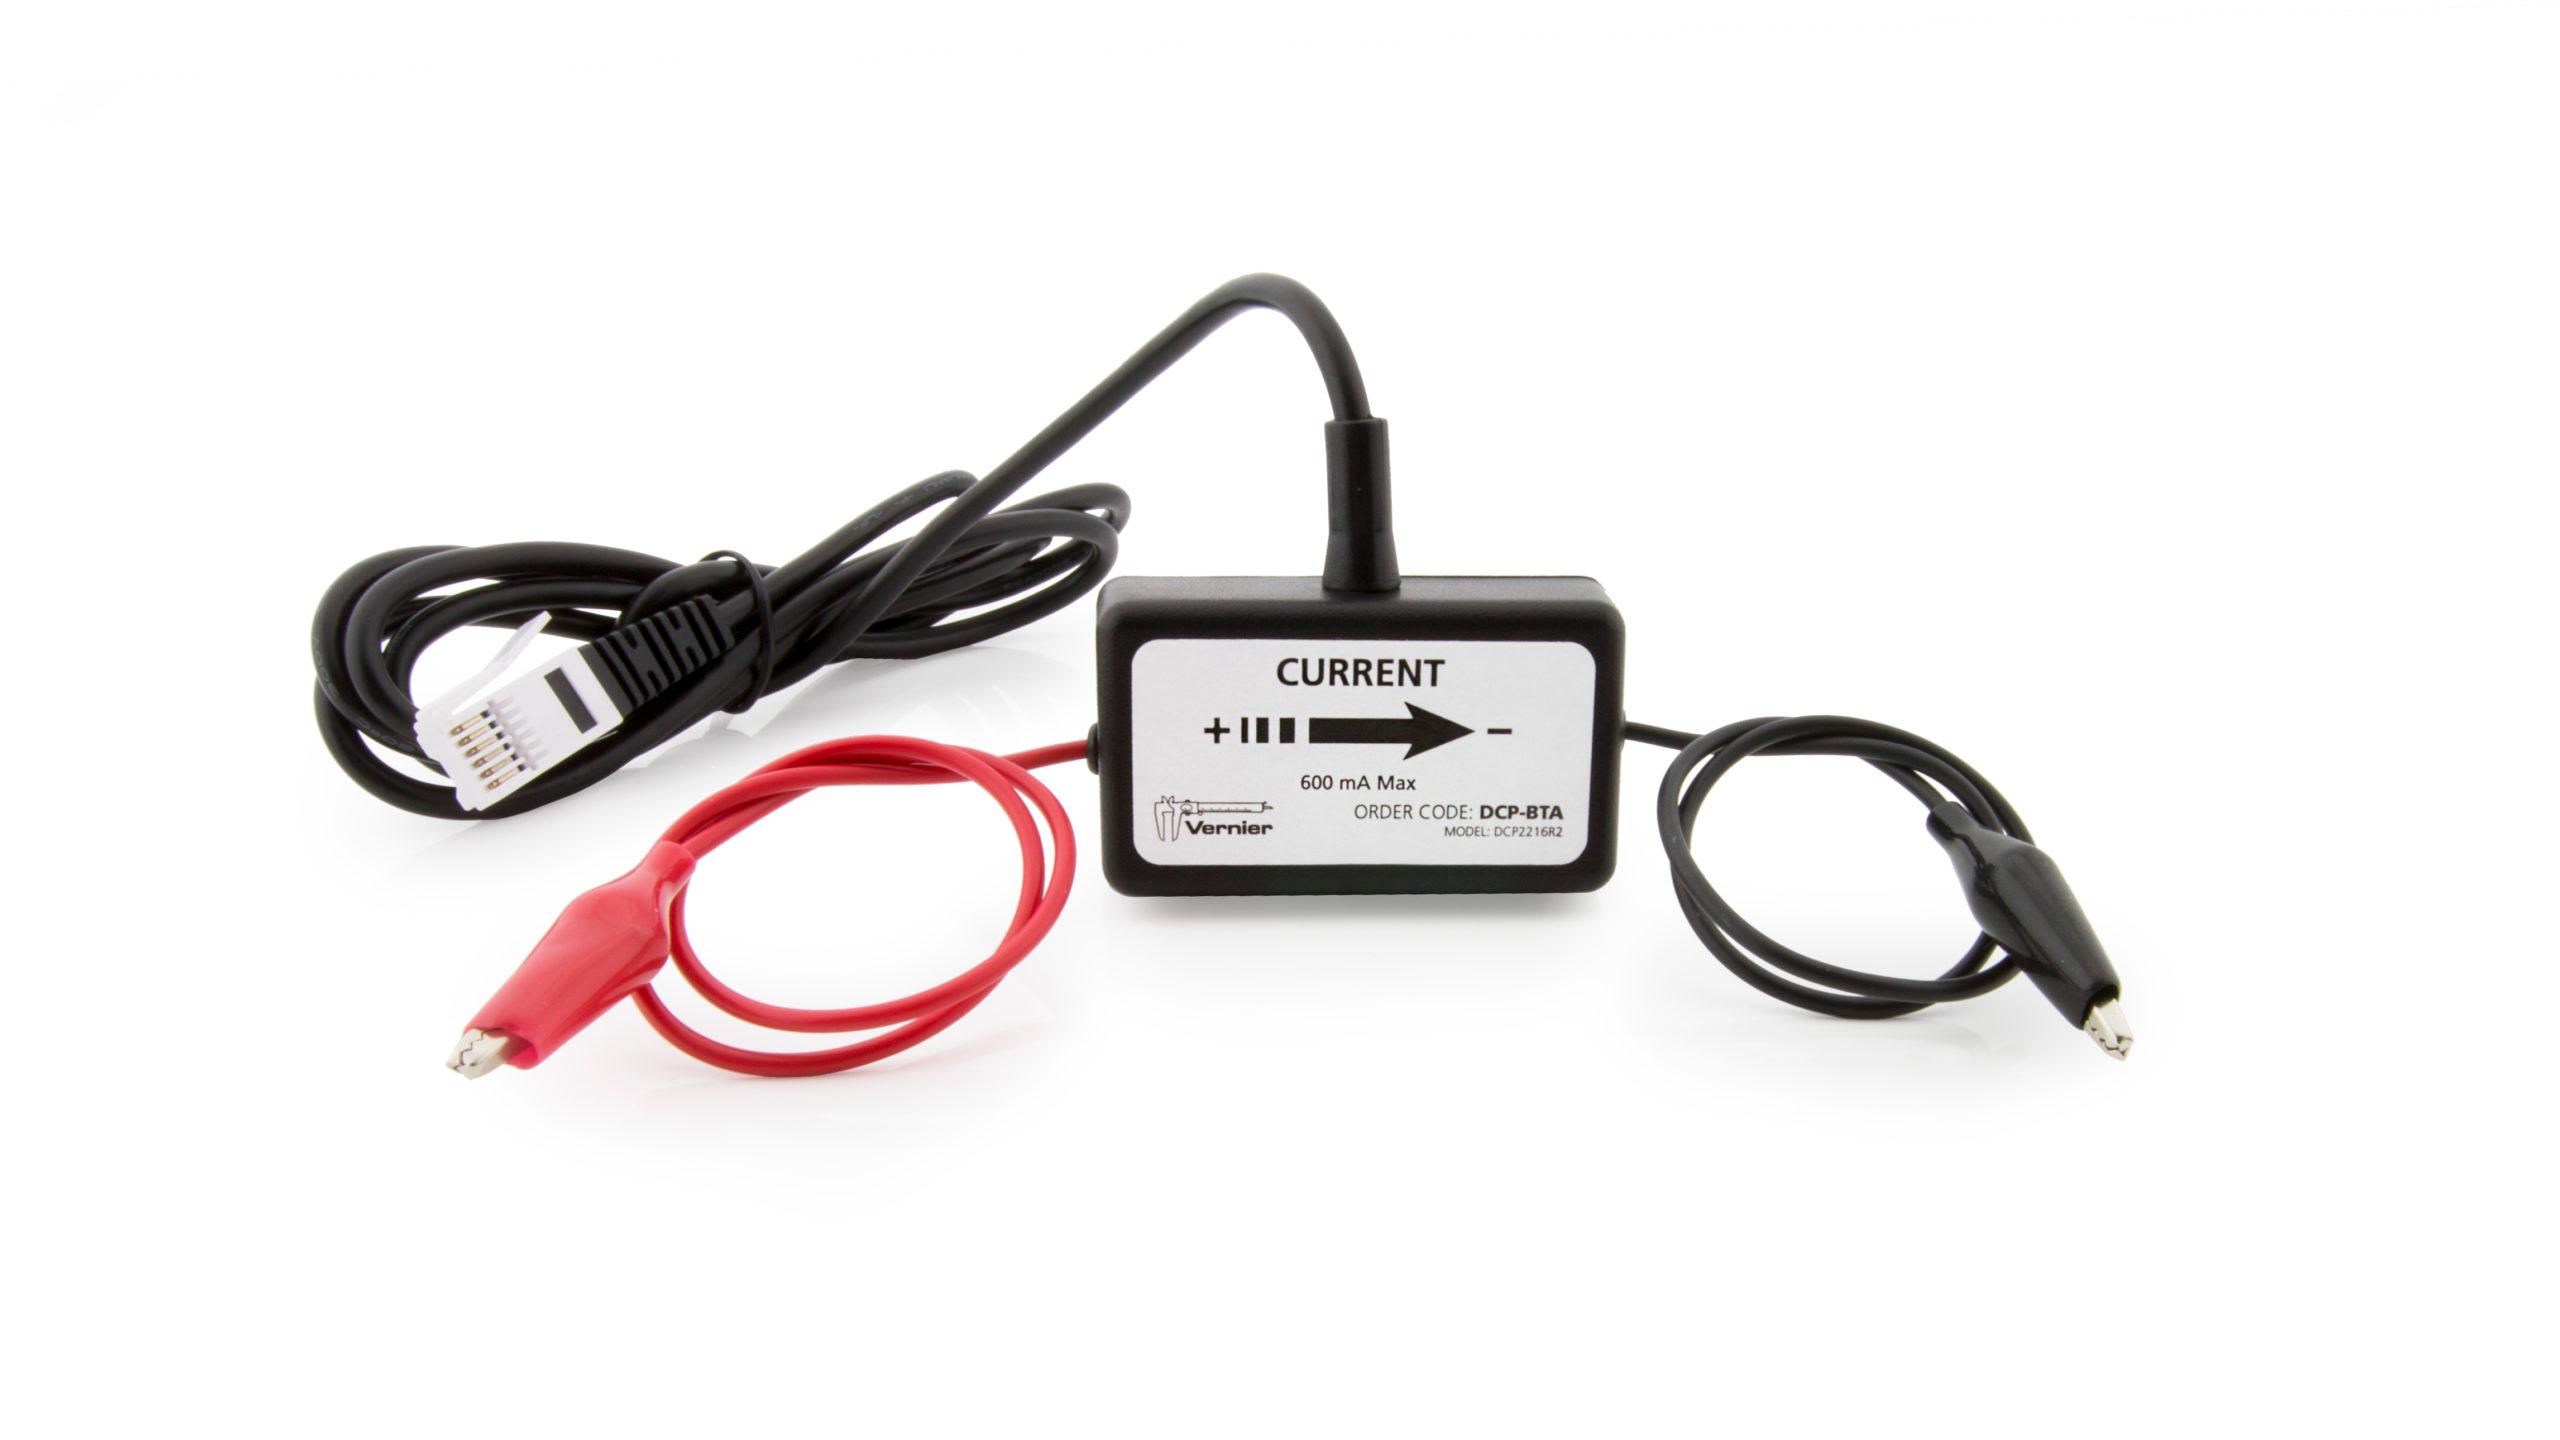
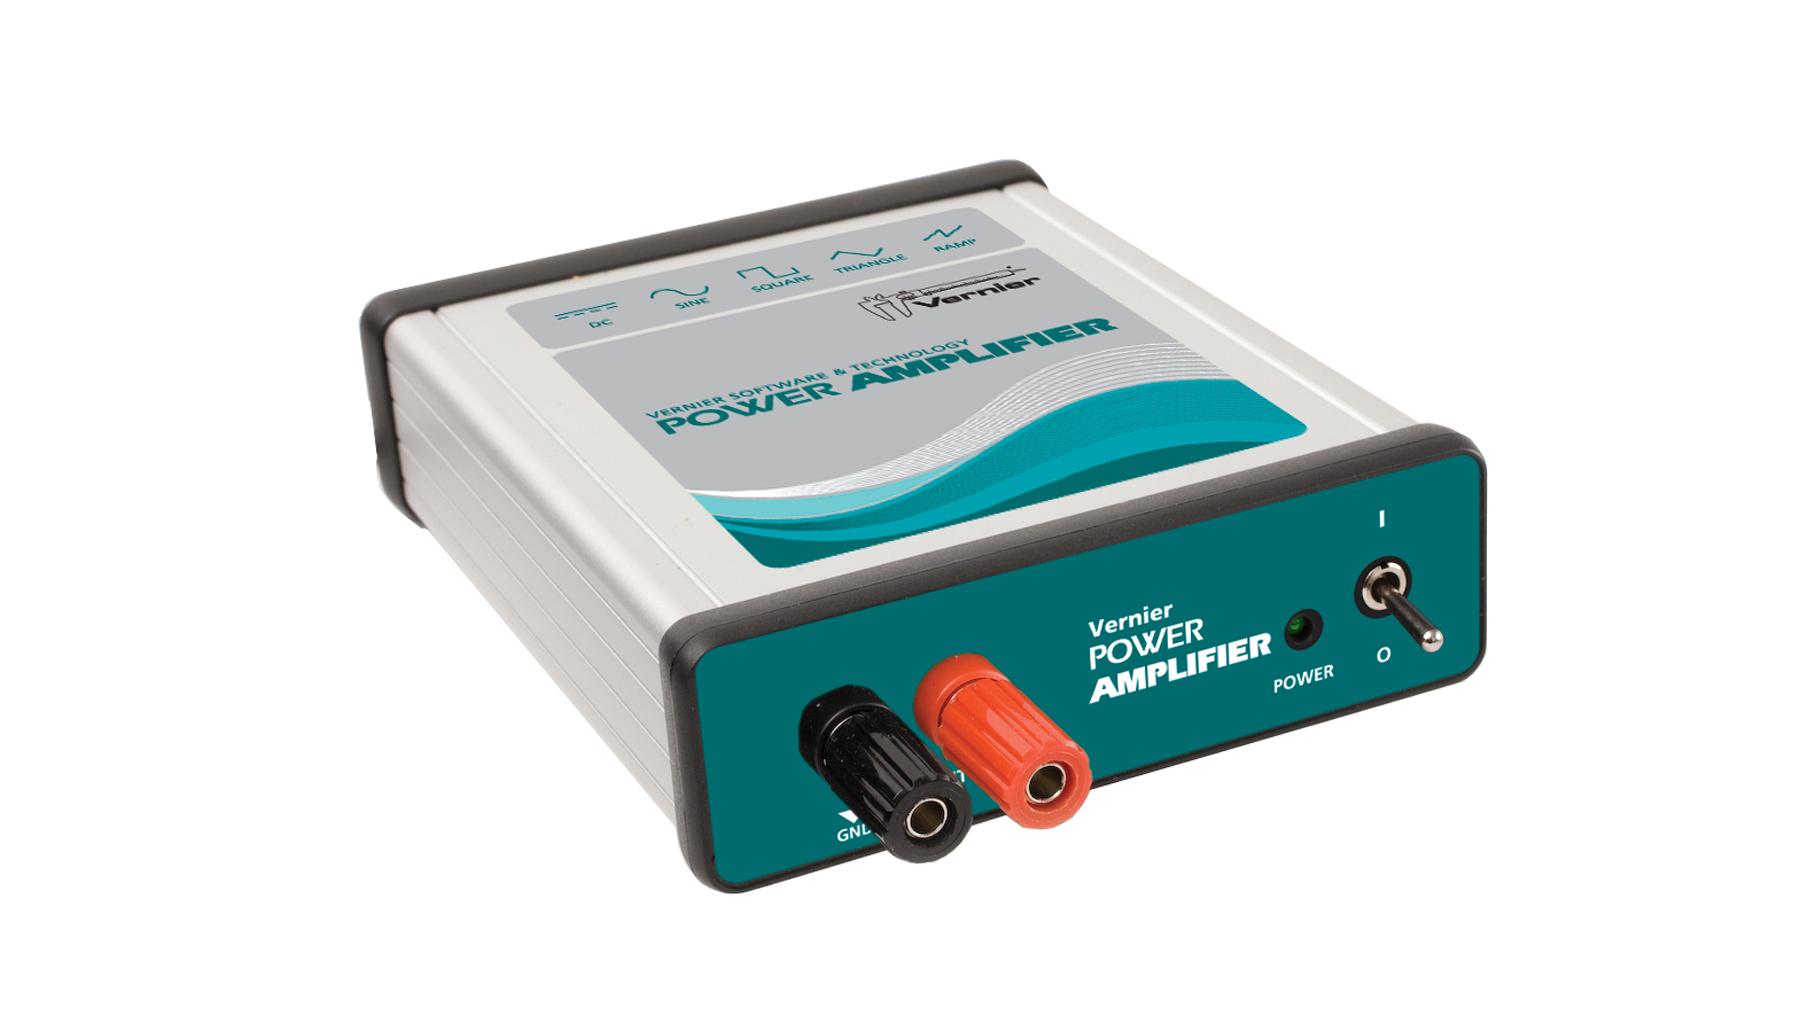
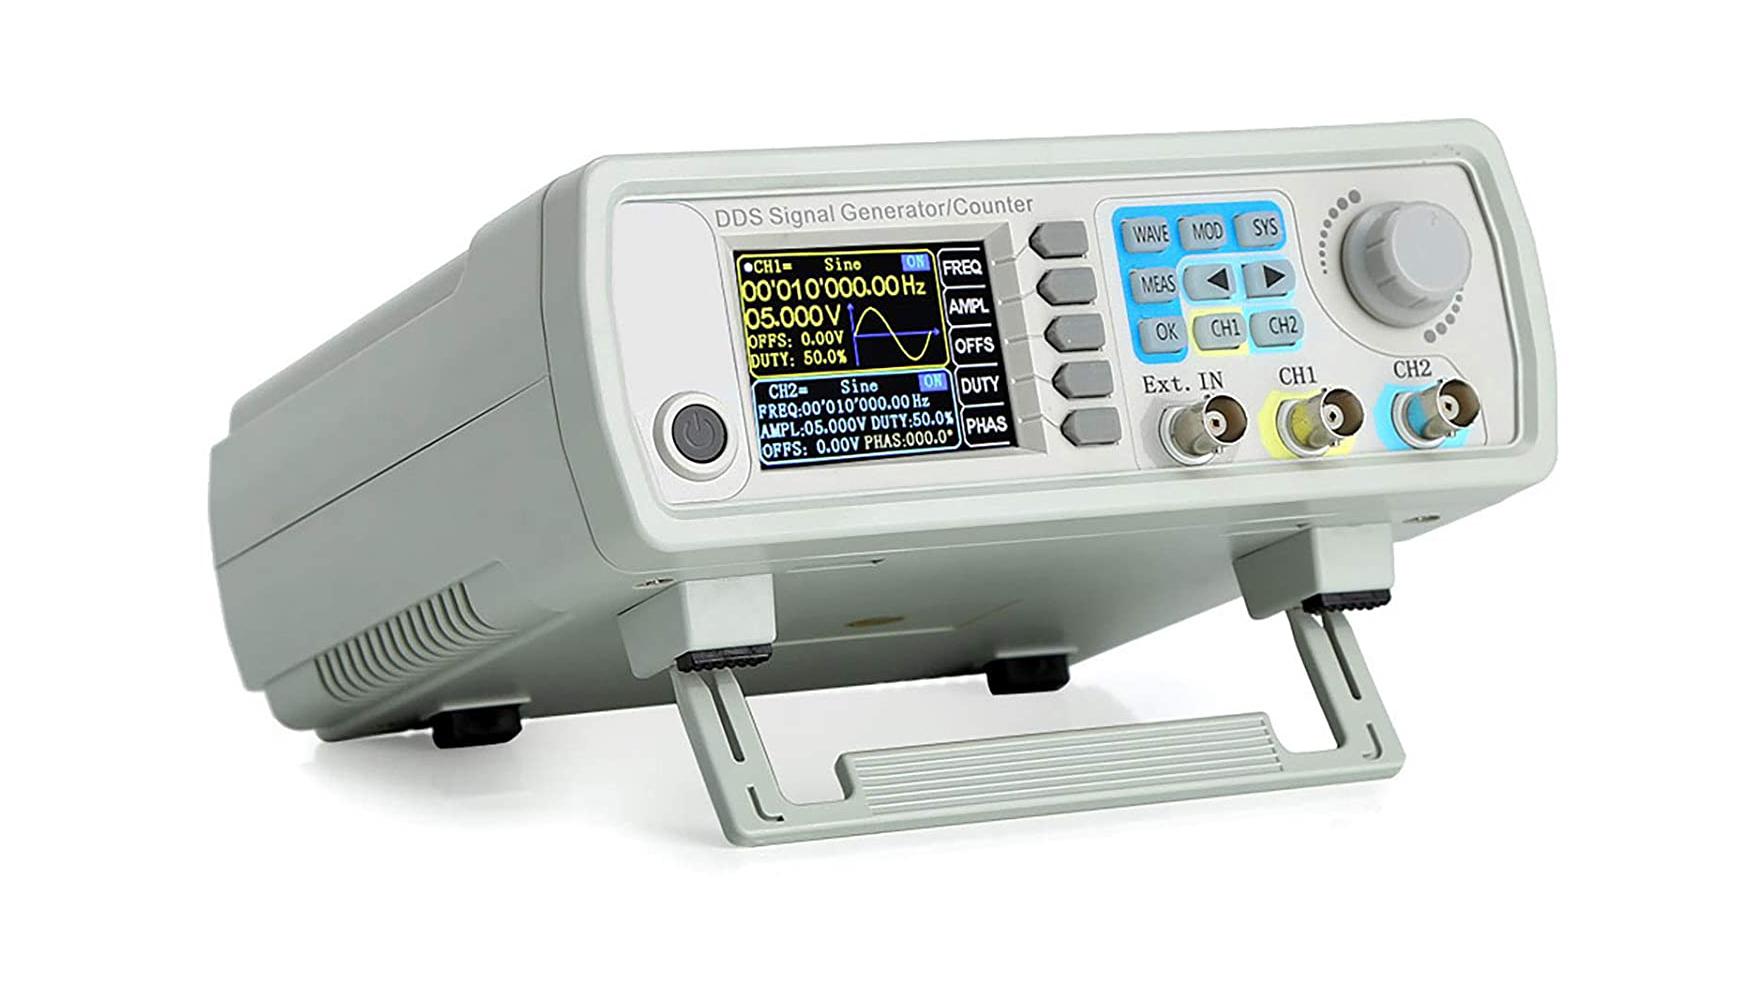
This experiment features the following sensors and equipment. Additional equipment may be required.
Correlations
Teaching to an educational standard? This experiment supports the standards below.
- International Baccalaureate (IB) 2025/Chemistry
- Structure 1.3.6—In an emission spectrum, the limit of convergence at higher frequency corresponds to ionization
- International Baccalaureate (IB) 2025/Physics
- The students should understand the photoelectric effect as evidence of the particle nature of light
- The students should understand that photons of a certain frequency, known as the threshold frequency, are required to release photoelectrons from the metal
- The students should understand Einstein’s explanation using the work function and the maximum kinetic energy of the photoelectrons as given by Emax = hƒ–Φ where Φ is the work function of the metal
Ready to Experiment?
Ask an Expert
Get answers to your questions about how to teach this experiment with our support team.
- Call toll-free: 888-837-6437
- Chat with Us
- Email support@vernier.com
Purchase the Lab Book
This experiment is #22 of Advanced Physics with Vernier — Beyond Mechanics. The experiment in the book includes student instructions as well as instructor information for set up, helpful hints, and sample graphs and data.


