That’s the Way the Ball Bounces – Height and Time for a Bouncing Ball
Experiment #10 from Real-World Math with Vernier
- Education Level
- High School
Introduction
Picture a bouncing ball. Between impacts with the floor, the ball rises and slows, then descends and speeds up. For any particular bounce, if the ball’s height is plotted as a function of time, the resulting graph has a parabolic shape. In other words, the relationship between height and time for a single bounce of a ball is quadratic. This relationship is expressed mathematically as

where y represents the ball’s height at any given time x. Another form of a quadratic equation is
^2} + k}")
where h is the x-coordinate of the vertex, k is the y-coordinate of the vertex, and a is a parameter. This way of writing a quadratic is called the vertex form.
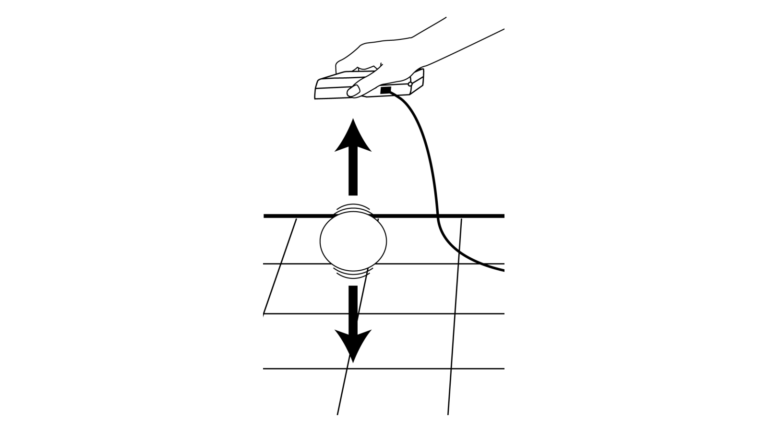
In this activity, you will record the motion of a bouncing ball using a Motion Detector. You will then analyze the collected data and model the variations in the ball’s height as a function of time during one bounce using both the general and vertex forms of the quadratic equation.
Objectives
- Record height versus time data for a bouncing ball.
- Model a single bounce using both the general and vertex forms of the parabola.
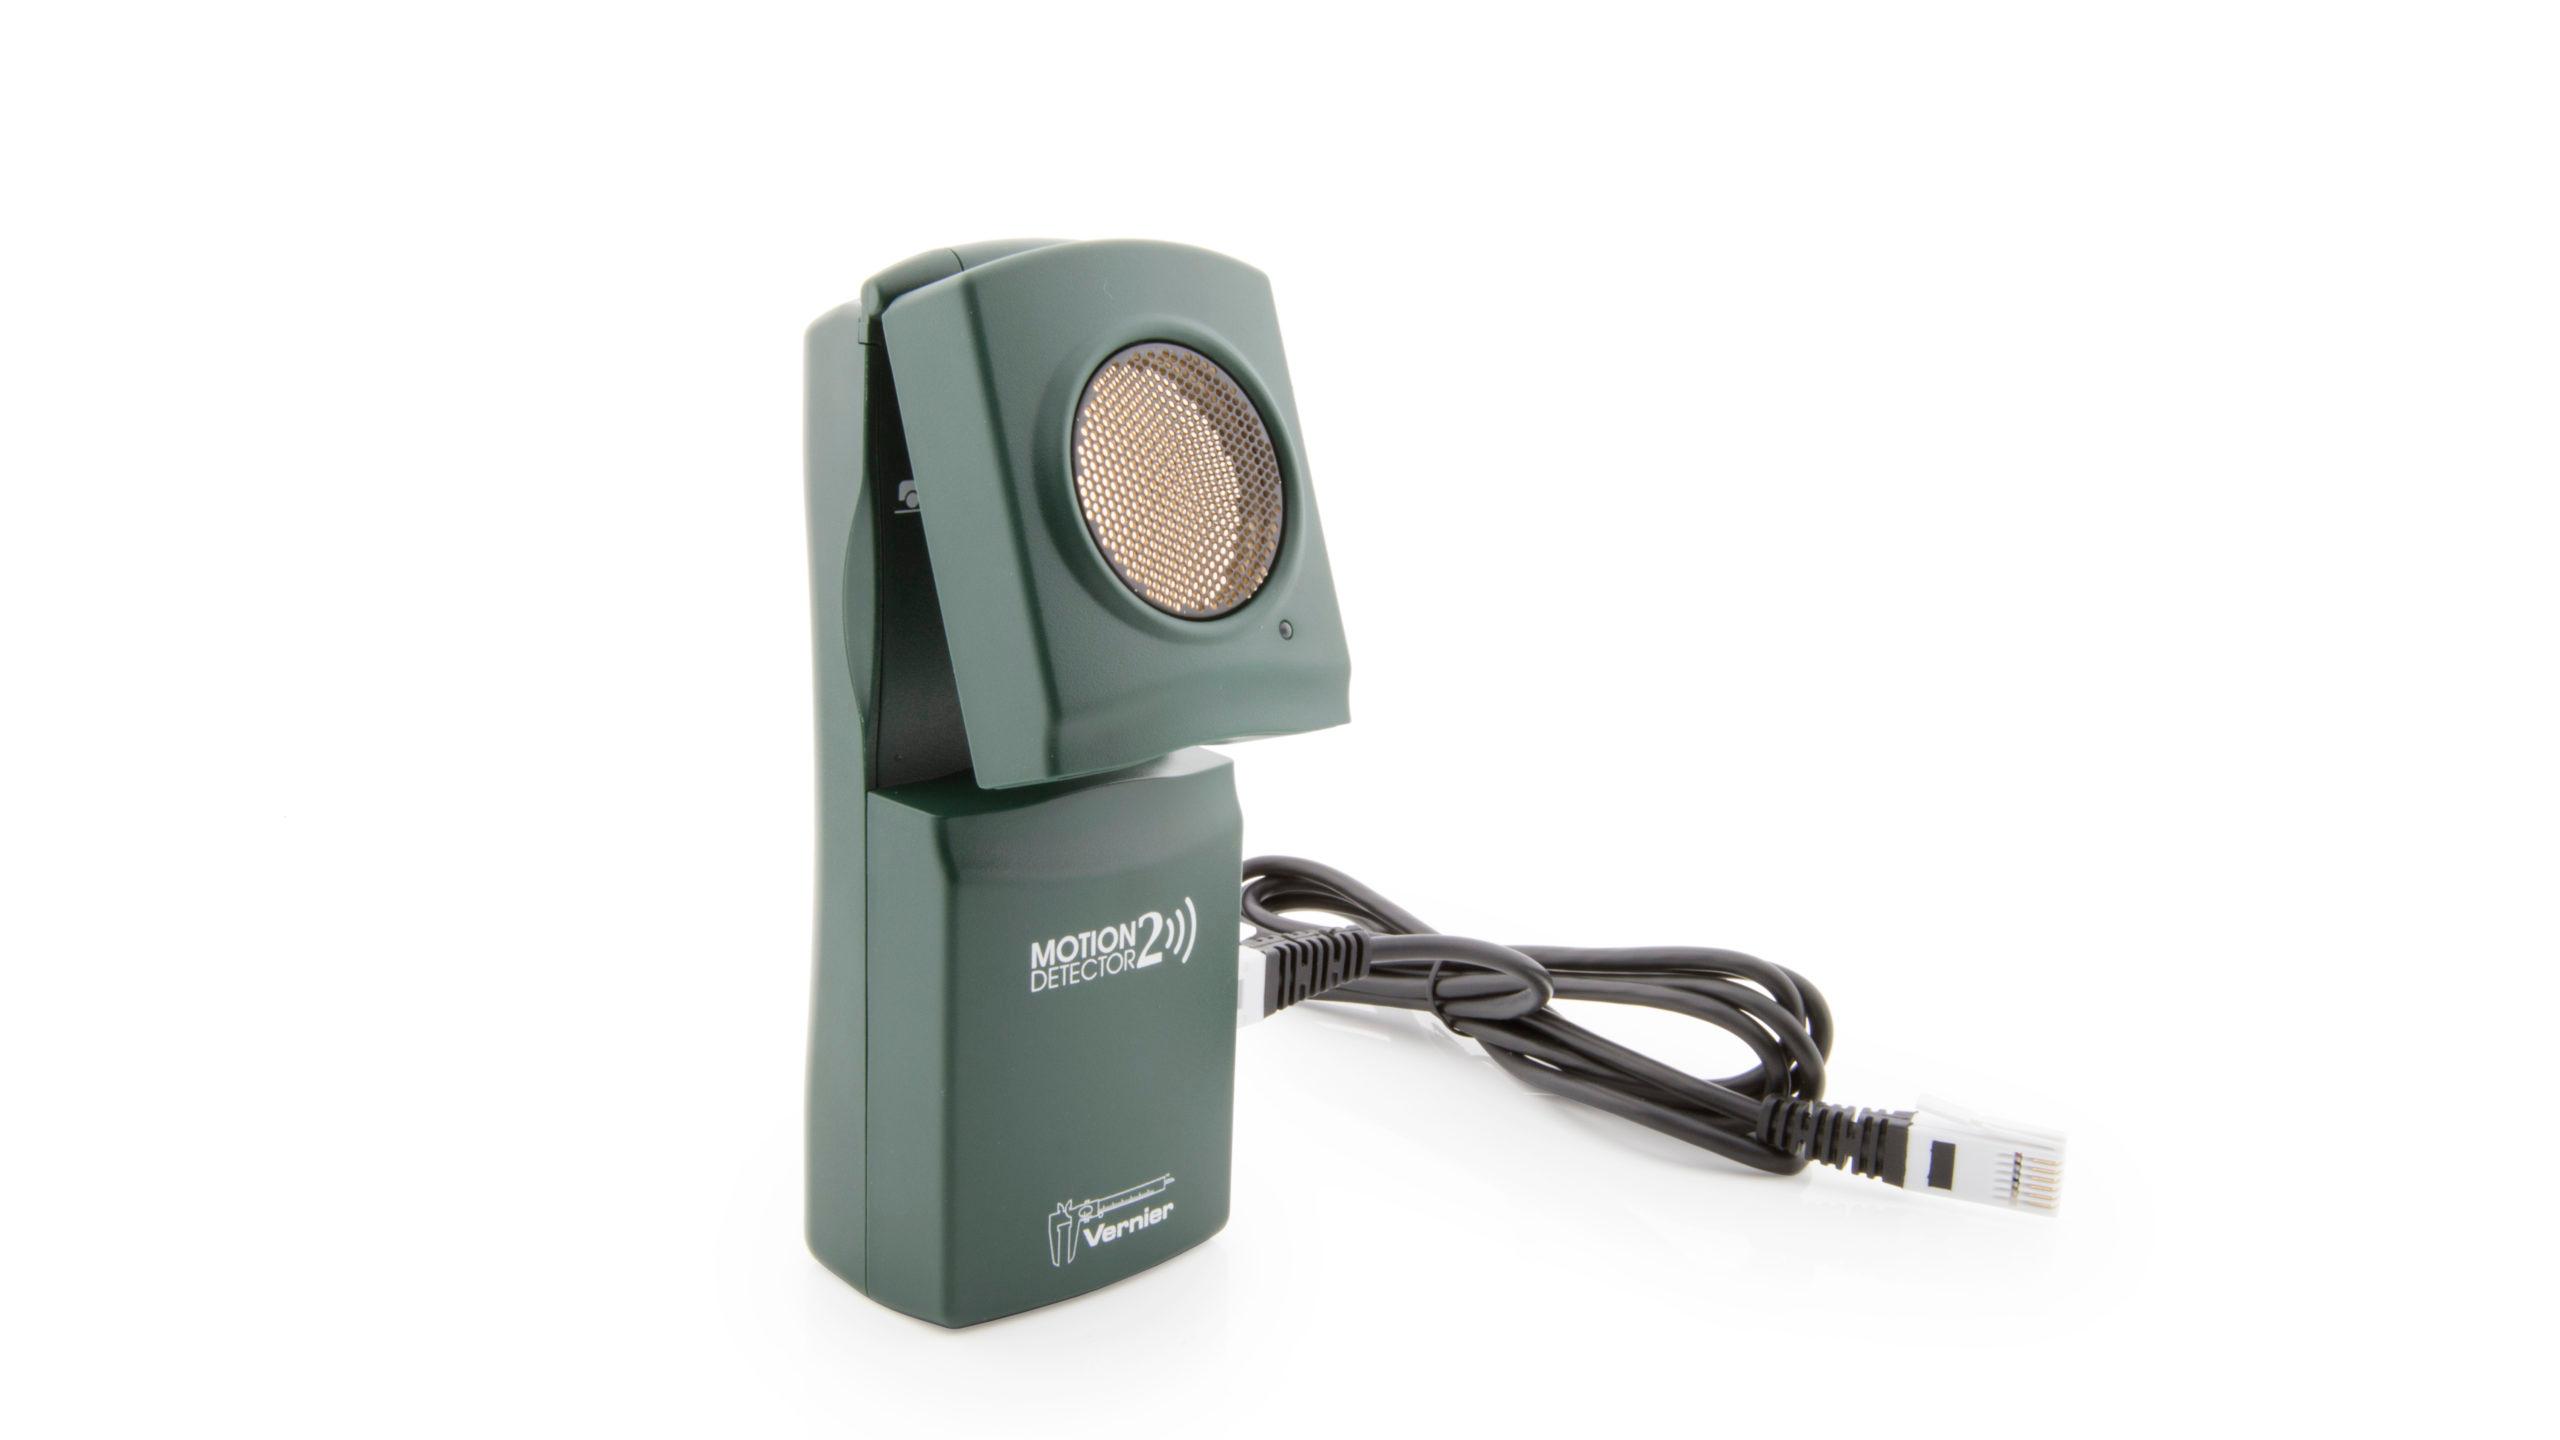
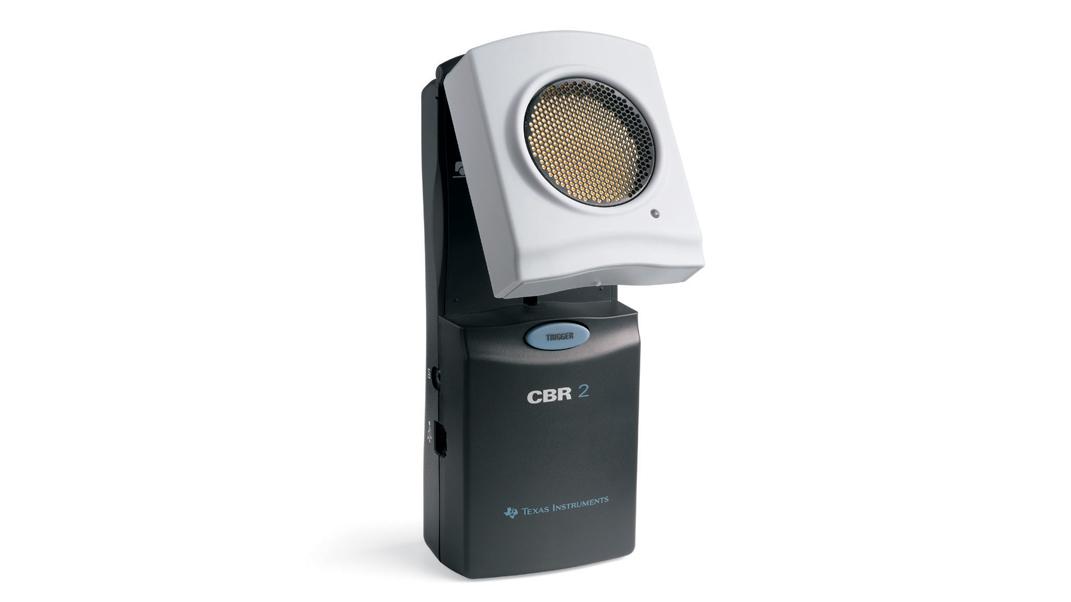
Sensors and Equipment
This experiment features the following sensors and equipment. Additional equipment may be required.
Option 1
Option 2
Ready to Experiment?
Ask an Expert
Get answers to your questions about how to teach this experiment with our support team.
- Call toll-free: 888-837-6437
- Chat with Us
- Email support@vernier.com
Purchase the Lab Book
This experiment is #10 of Real-World Math with Vernier. The experiment in the book includes student instructions as well as instructor information for set up, helpful hints, and sample graphs and data.