Streamline human physiology lessons with easy, engaging data-collection solutions from Vernier. Our tools promote hands-on learning that helps deepen comprehension about how our bodies work—and gets students excited about studying human physiology.
Human Physiology
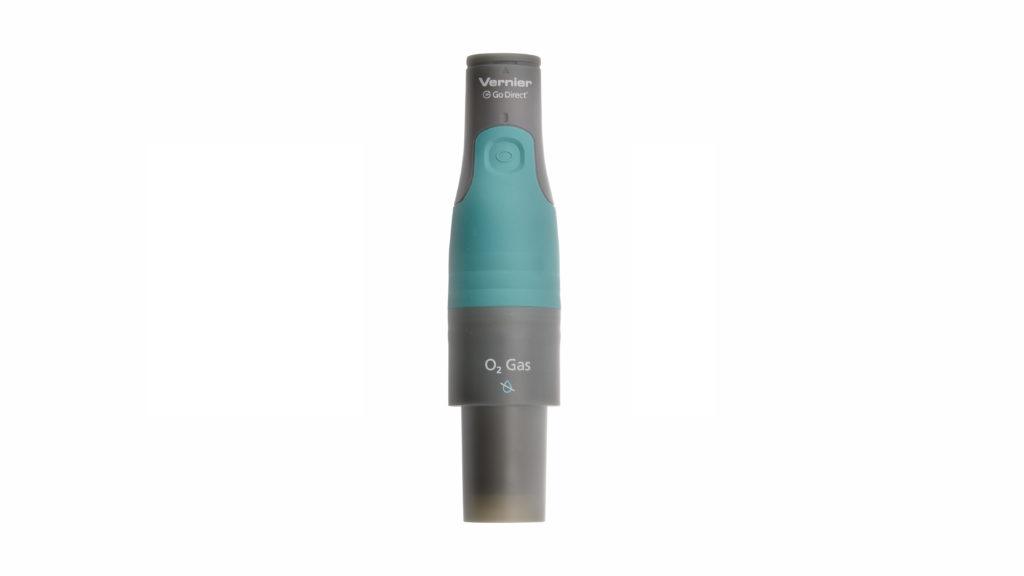
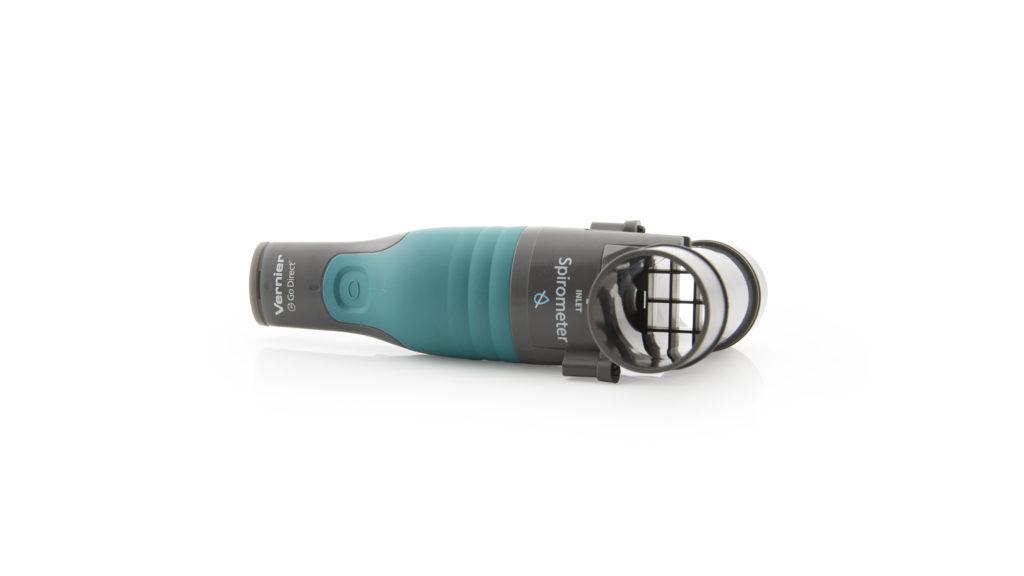
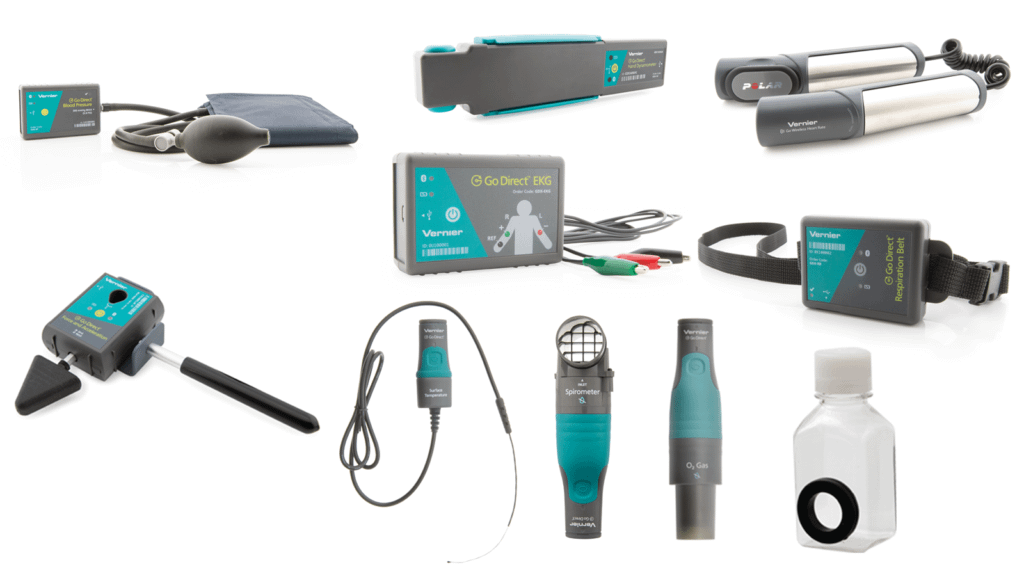
Build a foundation of biomedical science with our hands‑on data‑collection technology that measures heart rate, EKG, EMG, blood pressure, and lung function.
Help students form critical connections between abstract scientific ideas and the real world. With the Graphical Analysis app, students can visualize and interact with experiment data collected with nearly any Vernier sensor.
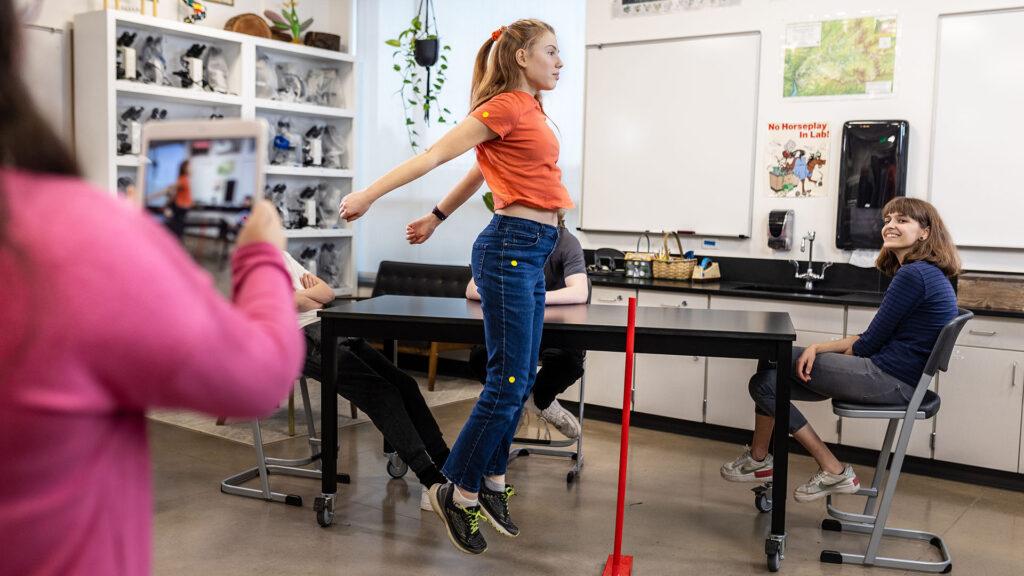
The Vernier Video Analysis® app simplifies video analysis for students, providing an easy-to-use platform to study human movement. Students can record videos of running, jumping, or other sports activities and then analyze the motion in the app to determine step rate, cadence, stride length, and more. Bring video analysis to all your students regardless of device—it even works with Chromebooks!
The Skin You’re In: Using Vernier Sensors to Teach Human Physiology
Help your students get to know the skin they’re in with our human physiology sensors! Watch our Director of Biology John Melville, PhD, demonstrate how to use our Go Direct Hand Dynamometer and Go Direct EKG Sensor.
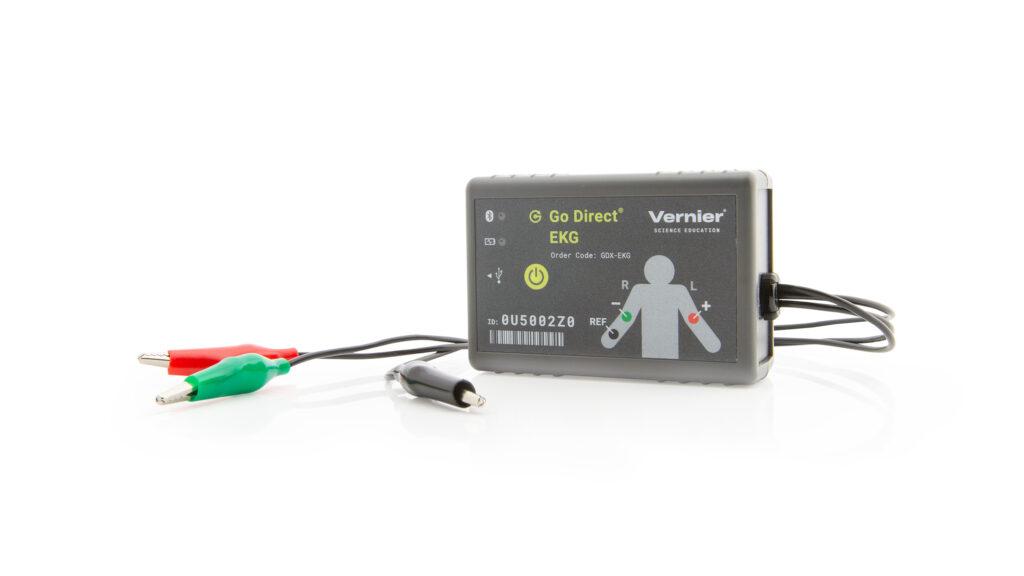
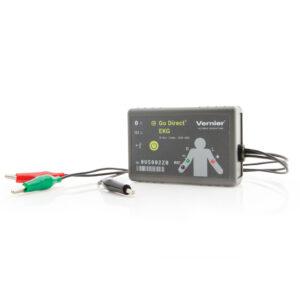
Answers to the Top Three Questions about the Go Direct EKG Sensor
Cut your lab time in half with our easy-to-use Go Direct EKG! Learn more about what an EKG signal should look like, how to use an EKG sensor for electromyography, and where to place electrodes for optimal data.
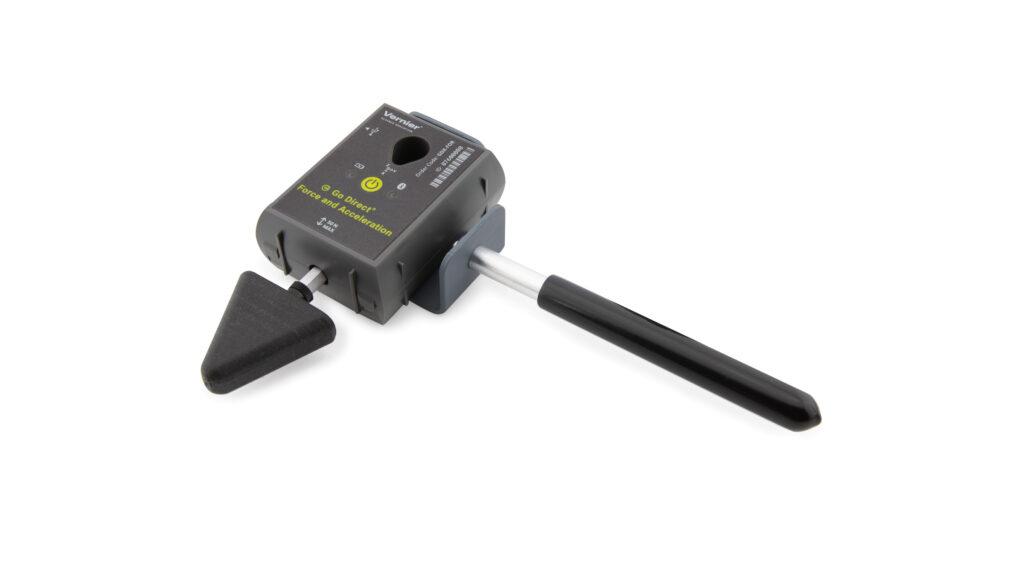
The Reflex Hammer Accessory Kit converts your Vernier force sensor into a reflex hammer. Use it to capture the strike of the hammer on a tendon. When used with an EKG sensor to record EMGs, students can study reflexes. By comparing the timing of the strike to the timing of the muscle activity, students can calculate the time required for a reflex to occur.
PLTW Biomedical Science (9–12) inspires students to make an impact on others’ lives and empowers them to pursue their life and career goals—whether they are aspiring health professionals, budding biomedical engineers, or future community health leaders.
As you implement data-collection technology into your teaching, we’re here to support you! Looking to learn more about our products or have questions about ordering? Reach out to our team at physiology@vernier.com.
If you are considering an adoption or seeking training options, we are here to support you every step of the way. Contact our solutions team at k12outreach@vernier.com.