Go Direct® Emissions Spectrometer User Manual
Order Code: GDX-SPEC-EM
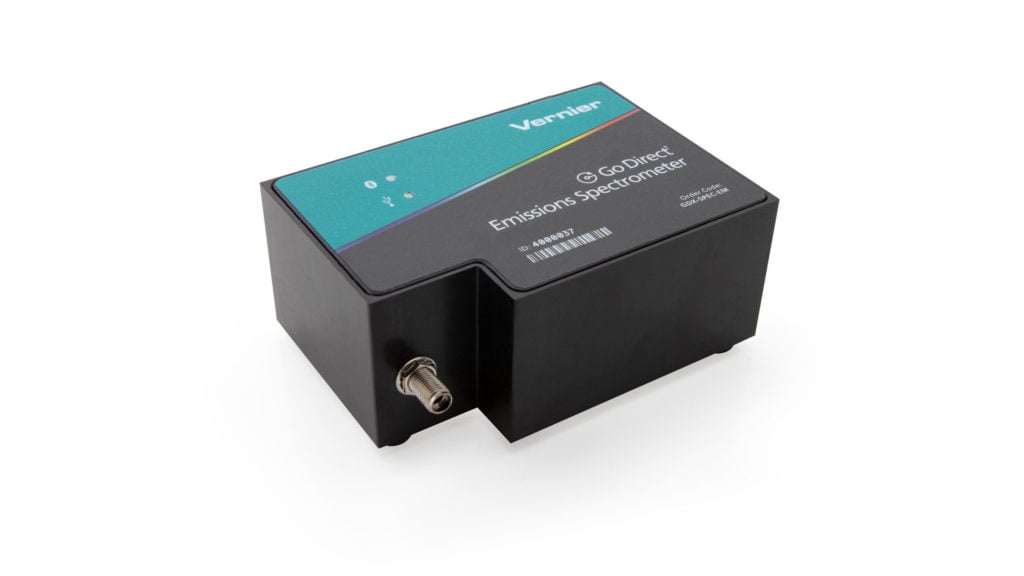
The Go Direct Emissions Spectrometer is a portable spectrometer designed to measure emissions from a wide variety of light sources.
Note: Vernier products are designed for educational use. Our products are not designed nor are they recommended for any industrial, medical, or commercial process such as life support, patient diagnosis, control of a manufacturing process, or industrial testing of any kind.
What's Included
- Go Direct Emissions Spectrometer
- Mini USB cable
- USB Power Adapter
Compatible Software and Interfaces
Choose a platform below to see its compatibility requirements.LabQuest
Interface LabQuest App LabQuest 3 Full support 1 LabQuest 2 Full support 1 LabQuest Full support 1 Compatibility Notes
Computers
Software Interface Spectral Analysis Graphical Analysis Logger Pro (discontinued) No interface required Full support Incompatible Full support 1 LabQuest 3 Incompatible Full support 2 Incompatible LabQuest 2 Incompatible Full support 2 Incompatible Compatibility Notes
Chromebook
Software Interface Spectral Analysis (Web App) No interface required Full support iOS
Software Interface Spectral Analysis Graphical Analysis Graphical Analysis GW No interface required Full support Incompatible Incompatible LabQuest 3 Incompatible Full support 1 2 Full support 1 2 LabQuest 2 Incompatible Full support 1 2 Full support 1 2 Compatibility Notes
Android
Software Interface Spectral Analysis Graphical Analysis Graphical Analysis GW No interface required Full support Incompatible Incompatible LabQuest 3 Incompatible Full support 1 2 Full support 1 2 LabQuest 2 Incompatible Full support 1 2 Full support 1 2 Compatibility Notes
Getting Started
Please see the following link for platform-specific connection information:
www.vernier.com/start/gdx-spec-em
|
Bluetooth Connection |
USB Connection |
|
Note: This sensor does not work with the original LabQuest. It works with LabQuest 2 or LabQuest 3.
|
Connecting the Spectrometer
See the following link for up-to-date connection information:
www.vernier.com/start/gdx-spec-em
Connecting via Bluetooth
| Ready to connect | Connect the USB to the USB power adapter or to a powered USB hub. Blue LED next to Bluetooth icon flashes when sensor is ready to connect. |
| Connected | Blue LED next to Bluetooth icon is solid when sensor is connected via Bluetooth wireless technology. |
Connecting via USB
| Connected | LED next to USB icon is solid green. |
Using the Spectrometer with Spectral Analysis
You may use your spectrometer to measure the emission spectrum of a light source such as an LED or a gas discharge tube. To do so, you may wish to purchase an optical fiber (www.vernier.com/vsp-em-fiber) though this is not required.
Connect the sensor following the steps in the Getting Started section of this user manual.
Measure Intensity of Light Emissions
Connect the Optical Fiber to the spectrometer (optional). Intensity is reported in relative units with a range of 0–1. Note: The spectrometer is not calibrated for measuring absolute intensity.
- Launch Spectral Analysis.
- Connect the spectrometer following the steps in the Getting Started section of this user manual.
- Select the appropriate Emissions experiment from the listed options and follow the prompts in the app.
- Aim the sensor opening or the tip of the optical fiber at a light source. Start data collection. Click or tap the Stop button to end data collection.
If the spectrum maxes out (flat and wide peaks at a value of 1), increase the distance between the light source and the tip of the optical fiber cable or reduce the integration time (see the Change the Settings in Spectral Analysis section).
Change the Settings in Spectral Analysis
- Click or tap the gear to show the Spectrometer Settings dialog.
- There are three parameters listed in the dialog box:
- Integration Time: This is similar to the shutter speed of a camera. When using the Intensity or Advanced Experiment modes, you can modify this value to decrease or increase the amount of light hitting the detector and the signal spectral output.
Under some circumstances, you may want to intentionally saturate some peaks in order to display weaker features. For example, in viewing a hydrogen spectrum, you may safely increase the Sample Time (which will saturate the red 656 nm line) in order to see the blue lines near 400 nm. - Wavelength Smoothing: This is the number of adjacent readings on either side of a given value that is used to calculate an average value.
- Temporal Averaging: This is the number of readings taken at a given wavelength to calculate an average reading.
- Integration Time: This is similar to the shutter speed of a camera. When using the Intensity or Advanced Experiment modes, you can modify this value to decrease or increase the amount of light hitting the detector and the signal spectral output.
- Select the Calibrate button to recalibrate your spectrometer at any time. This is useful in a well-lit area where you may want to subtract a baseline reading.
Using the Spectrometer with LabQuest
You may use your spectrometer to measure the emission spectrum of a light source such as an LED or a gas discharge tube. To do so, you may wish to purchase an optical fiber (www.vernier.com/vsp-em-fiber) though this is not required.
Connect the spectrometer to LabQuest via USB.
Measure Intensity of Light Emissions
Connect the Optical Fiber to the spectrometer (optional). Intensity is reported in relative units with a range of 0–1. Note: The spectrometer is not calibrated for measuring absolute intensity.
- Aim the sensor opening or the tip of the optical fiber cable at a light source.
- Start data collection.
- Tap the red Stop button to end data collection.
If the spectrum saturates, displaying flat and wide peaks near 1.0, increase the distance between the light source and the sensor or tip of the optical fiber cable. You can also adjust data-collection parameters by tapping Sensors and choosing Data Collection. Reduce the Sample Time until peaks are less than 1.0.
Under some circumstances, you may want to intentionally saturate some peaks in order to display weaker features. For example, in viewing a hydrogen spectrum, you may safely increase the Sample Time (which will saturate the red 656 nm line) in order to see the blue lines near 400 nm.
Using the Spectrometer with Logger Pro
You may use your spectrometer to measure the emission spectrum of a light source such as an LED or a gas discharge tube. To do so, you may wish to purchase an optical fiber (www.vernier.com/vsp-em-fiber) though this is not required.
Connect the spectrometer to Logger Pro via USB.
Measure Intensity of Light Emissions
Connect the Optical Fiber to the spectrometer (optional). Intensity is reported in relative units with a range of 0–1. Note: The spectrometer is not calibrated for measuring absolute intensity.
- Aim the sensor opening or the tip of the optical fiber cable at a light source.
- Click
 .
. - Click
 to end data collection.
If the spectrum saturates, displaying flat and wide peaks near 1.0, increase the distance between the light source and the sensor or tip of the optical fiber cable. You can also change the Sample Time until peaks are less than 1.0. See Change the Settings in Logger Pro Spectrometer Dialog Box, below).
Under some circumstances, you may want to intentionally saturate some peaks in order to display weaker features. For example, in viewing a hydrogen spectrum, you may safely increase the Sample Time (which will saturate the red 656 nm line) in order to see the blue lines near 400 nm.
Change the Settings in Logger Pro Spectrometer Dialog Box
The Spectrometer dialog box lists all the settings for the device. To display this box choose Set Up Sensors ► Spectrometer from the Experiment menu.
For most experiments, the default settings work well.
There are four parameters listed in the dialog box.
- Sample Time: This is similar to the shutter speed of a camera. Logger Pro has a stored sample time. You may need to change the sample time manually.
- Wavelength Smoothing: This is the number of adjacent readings on either side of a given value that is used to calculate an average value. Large values will broaden sharp peaks.
- Samples to Average: This is the number of scans taken to calculate an average scan. Use a value more than 1 to reduce noise.
- Wavelength Range: The range is determined by the type of spectrometer in use.
By clicking on the spectrum icon in this dialog box, you will gain access to two options: Configure Collection… and Go to Support Web Page. You will also see that the calibration is set to Intensity <Computer>. Click on an item to select it.
Overlaying Data on the Same Graph
You may wish to bring data from another Logger Pro 3 file into a current file. Using the example of testing the fluorescent lighting in a classroom for the presence of mercury, follow these steps in Logger Pro.
- Measure the emission spectrum of a fluorescent lamp.
- Open the File menu and choose Import From ► Logger Pro file.
- From the Experiment folder, open Sample Data ► Physics ► Gas Discharge Spectra ► Mercury.
- Place your cursor anywhere on the Logger Pro graph screen and double-click. In the Graph Options dialog box, click the Options tab.
- In the Y-axis Columns box, open Run 1 and select the check box next to Intensity. Click
 .
.
Specifications
|
Dimensions |
10.1 cm × 7.0 cm × 4.5 cm |
|
Power supply |
USB powered |
|
Detector |
Linear CCD |
|
Wavelength range |
350 nm–900 nm |
|
Wavelength reporting interval |
1 nm |
|
Optical resolution* |
3 nm |
|
Typical wavelength accuracy† |
±2 nm |
*as determined by the full width of half maximum of Hydrogen 434 nm peak
†as determined by Hydrogen peaks. For best accuracy use an optical fiber.
Safety
- No user-serviceable parts are in this device. Do not attempt to open or modify this device. Contact Vernier for all repairs and service.
- Handle the device with care. This instrument can be damaged if it is dropped.
- Do not use this instrument if it is damaged in any way. Contact Vernier Technical Support for troubleshooting and technical assistance.
- Do not use this instrument for clinical or diagnostic procedures.
Troubleshooting
Find troubleshooting tips here: www.vernier.com/til/3157
Repair Information
- Contact Vernier for all repairs and service.
- No user-serviceable parts are in this device. Do not attempt to open the case of the device. Doing so will create an unsafe operating condition and will void the product warranty.
If you have watched the related product video(s), followed the troubleshooting steps, and are still having trouble with your Go Direct Emissions Spectrometer, contact Vernier Technical Support at support@vernier.com or call 888-837-6437. Support specialists will work with you to determine if the unit needs to be sent in for repair. At that time, a Return Merchandise Authorization (RMA) number will be issued and instructions will be communicated on how to return the unit for repair.
Accessories/ Replacements
| Item | Order Code |
|---|---|
|
VSP-EM-FIBER |
|
|
CB-USB-MINI |
Warranty
Warranty information for this product can be found on the Support tab at www.vernier.com/gdx-spec-em/#support
General warranty information can be found at www.vernier.com/warranty
Contact Support
Fill out our online support form or call us toll-free at 1-888-837-6437.