Vernier UV-VIS Spectrophotometer User Manual
Order Code: VSP-UV
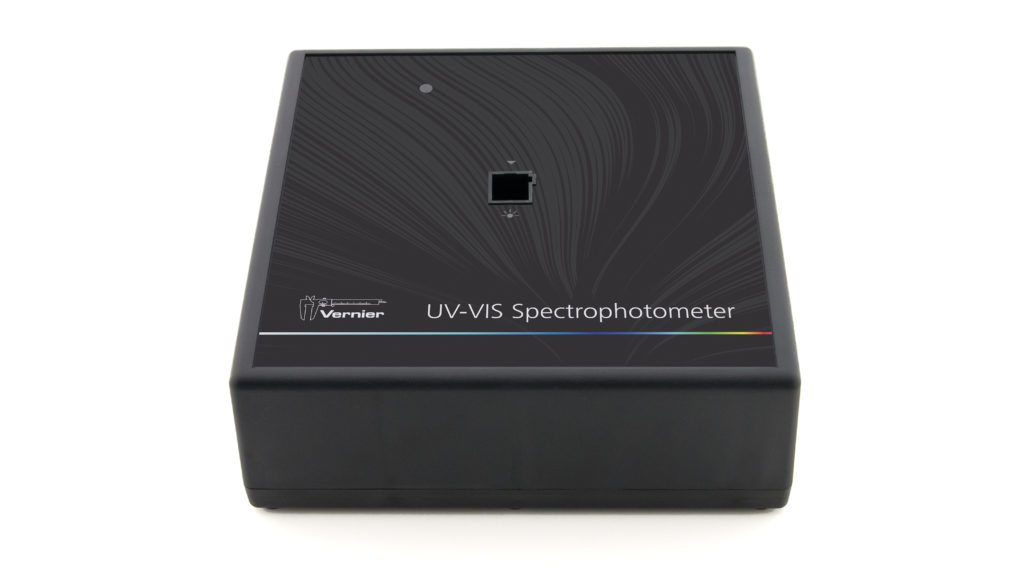
The Vernier UV-VIS Spectrophotometer is a portable ultraviolet and visible light spectrophotometer.
Note: Vernier products are designed for educational use. Our products are not designed nor are they recommended for any industrial, medical, or commercial process such as life support, patient diagnosis, control of a manufacturing process, or industrial testing of any kind.
What's Included
- Vernier UV-VIS Spectrophotometer
- AC Power Supply
- Starna quartz cuvettes (2)
- Mini USB cable
Compatible Software and Interfaces
Choose a platform below to see its compatibility requirements.LabQuest
Interface LabQuest App LabQuest 3 Full support LabQuest 2 Full support LabQuest Full support Computers
Software Interface Spectral Analysis Graphical Analysis Logger Pro (discontinued) No interface required Full support Incompatible Full support LabQuest 3 Incompatible Full support 1 Incompatible LabQuest 2 Incompatible Full support 1 Incompatible Compatibility Notes
Chromebook
Software Interface Spectral Analysis (Web App) No interface required Full support iOS
Software Interface Graphical Analysis Graphical Analysis GW LabQuest 3 Full support 1 Full support 1 LabQuest 2 Full support 1 Full support 1 Compatibility Notes
Android
Software Interface Graphical Analysis Graphical Analysis GW LabQuest 3 Full support 1 Full support 1 LabQuest 2 Full support 1 Full support 1 Compatibility Notes
See www.vernier.com/manuals/vsp-uv for a list of interfaces and software compatible with the Vernier UV-VIS Spectrophotometer.
Getting Started
- Connect the AC power supply to the spectrophotometer. Turn the power switch to the ON position. Wait for the lamp indicator LED to remain green.
- Connect the spectrophotometer directly to the USB port.
- Launch Spectral Analysis or turn on LabQuest 2. Note: You can also use Logger Pro; however, Spectral Analysis, our free app dedicated to spectroscopy, is recommended.
The software will identify the sensor and load a default data-collection setup. You are now ready to continue your experiment.
Using the Product with Spectral Analysis
Connect the sensor following the steps in the Getting Started section of this user manual.
Select the Type of Data to Measure
The three options for Experiment Types are:
- Measurement vs. Wavelength—collect a full spectrum.
- Measurement vs. Concentration—conduct a Beer's law experiment.
- Measurement vs. Time—collect time-based data for a kinetics experiment.
By default, Absorbance is expanded. You can also choose from % Transmittance, Emissions, or Advanced Full Spectrum. Use the Advanced Full Spectrum mode to switch among all the measurement types in the same session. For complete instructions, refer to the Spectral Analysis user manual at www.vernier.com/spectral-analysis
Measurement vs. Wavelength (Full Spectrum)
- Select Measurement vs. Wavelength.
- If applicable, follow instructions for calibration. Align the cuvette so the clear side of the cuvette is facing the light source. Note: Calibration is not required for intensity.
- You are now ready to collect data. Fill a cuvette about 3/4 full of a sample of the solution to be tested. Place the sample in the Spectrophotometer and click or tap Collect. Click or tap Stop to end data collection. The spectrum is automatically stored.
- Save or export your data from the File menu.
Measurement vs. Concentration (Beer's law)
- Select Measurement vs. Concentration.
- If applicable, follow instructions for calibration. Align the cuvette so the clear side of the cuvette is facing the light source. Note: Calibration is not required for intensity.
- Follow the instructions in the Choose a Wavelength dialog box. Select Done.
- Click or tap Collect. Your first sample should still be in the Spectrophotometer. After the reading stabilizes, click or tap Keep. Enter the concentration of the sample and click or tap Keep Point.
- Place your second sample in the cuvette slot. After the reading stabilizes, click or tap Keep. Enter the concentration of the sample and click or tap Keep Point.
- Repeat the previous step for the remaining samples. When finished, click or tap Stop to end data collection. The data is automatically stored.
- To see the best fit line equation for the standard solutions, click or tap Graph Tools, select Apply Curve Fit, and choose Linear. Click or tap Apply.
- If doing Beer's law to determine the concentration of an unknown, place the unknown sample in the cuvette holder. Click or tap Graph Tools and enable Interpolate. Click or tap along the line until you find the concentration value that matches your unknown's measurement.
- Save or export your data from the File menu.
Measurement vs. Time (Kinetics)
- Select Measurement vs. Time.
- If applicable, follow instructions for calibration. Align the cuvette so the clear side of the cuvette is facing the light source. Note: Calibration is not required for intensity.
- Follow the instructions in the Choose a Wavelength dialog box. Select Done.
- The default data-collection settings collect measurements every two seconds until the user manually stops data collection.
- Mix the reactants. Transfer ~2 mL of the reaction mixture to a cuvette and place the cuvette in the spectrometer. Click or tap Collect.
- When finished, click or tap Stop.
- To fit a function to the data, click or tap Graph Tools, select Apply Curve Fit, and choose the appropriate curve fit. Click or tap Apply.
- To add a calculated column to the data set, click or tap OK in the measurement header on the data table. Select Add Calculated Column. Modify the name, units, and displayed precision accordingly. Select Insert Expression and select the appropriate equation. Modify the parameters and column options, if necessary. Click or tap Apply. The calculated column is automatically displayed on the graph.
- Save or export your data from the File menu.
Change the Settings in Spectral Analysis
- Click or tap the gear to show the Spectrometer Settings dialog.
- There are three parameters listed in the dialog box:
- Integration Time: This is similar to the shutter speed of a camera. Spectral Analysis automatically selects the proper sample time during calibration in Absorbance and % Transmittance modes. If using Intensity or Advanced Experiment modes, you can modify this value to increase the amount of light hitting the detector and the signal spectral output.
- Wavelength Smoothing: This is the number of adjacent readings on either side of a given value that is used to calculate an average value.
- Temporal Averaging: This is the number of readings taken at a given wavelength to calculate an average reading.
- Select the Calibrate button to recalibrate your spectrometer at any time.
Measure an Emission Spectrum with Spectral Analysis
You may use your Spectrophotometer to measure the emission spectrum of a light source such as an LED or a gas discharge tube. To do so, you will need to purchase the Vernier Optical Fiber (order code: VSP-FIBER).
Measure Intensity of Light Emissions
Insert the Vernier Optical Fiber into the spectrometer.
- Connect the sensor following the steps in the Getting Started section of this user manual.
- Launch Spectral Analysis.
- Select the appropriate Emissions experiment from the listed options and follow the prompts in the app. Intensity is a relative measure with a range of 0–1. Note: The Spectrophotometer is not calibrated for measuring intensity.
- Aim the tip of the optical fiber at a light source. Start data collection. Tap the Stop button to end data collection.
If the spectrum maxes out (flat and wide peaks at a value of 1), increase the distance between the light source and the tip of the optical fiber cable or reduce the integration time (see the Change the Settings in Spectral Analysis section).
To adjust the integration time, click or tap the gear. Set the integration time to a suitable value.
Using the Spectrophotometer with LabQuest
Select the Type of Data (or Units) You Want to Measure
There are three general types of data collection that measure absorbance or transmittance—absorbance (or %T) vs. wavelength, which produces a spectrum, absorbance (or %T) vs. concentration for Beer’s law experiments, and absorbance (or %T) vs. time for kinetics experiments.
The default data type is absorbance. If you want to measure the absorbance of a solution, proceed directly to the Calibrate section.
If you want to measure %T or intensity, do the following:
- From the Sensors menu, choose Change Units ► USB: Spectrophotometer.
- Select the unit or data type you wish to measure.
Calibrate the Spectrophotometer (Not Required if Measuring Intensity)
- Choose Calibrate ► USB: Spectrophotometer from the Sensors menu. Note: For best results, allow the Spectrophotometer to warm up for a minimum of five minutes.
- Fill a cuvette about 3/4 full with distilled water (or the solvent being used in the experiment) to serve as the blank. After the Spectrophotometer has warmed up, place the blank cuvette in the Spectrophotometer. Align the cuvette so a clear side of the cuvette is facing the light source.
- Follow the instructions in the dialog box to complete the calibration, and then tap OK.
Collect Data with LabQuest
Measurement vs. Wavelength (Generate a Spectrum)
- Fill a cuvette about 3/4 full of the solution to be tested and place it in the Spectrophotometer.
- Start data collection by tapping on the Start button in the lower left corner of the screen. Tap the Stop button to end data collection.
- Select wavelength. You can tap on the graph to select a wavelength. Another way to change the wavelength is to navigate to the Meter screen, tap on the meter, and select Change Wavelength. Enter the wavelength of your choice and select OK. If the wavelength you type in is not measured by the unit, LabQuest will automatically choose the wavelength closest to your choice.
- To store the spectrum data, tap on the file cabinet icon in the upper right of your screen.
Measurement vs. Concentration (Beer’s Law Studies)
- Generate a spectrum as described above. On the Meter screen, tap Mode. Change the mode to Events with Entry.
- Enter the Name (e.g., Concentration) and Units (e.g., mol/L). Select OK.
- A message will appear warning you to either save or discard the full spectrum run. Make your choice and proceed with data collection.
- Place your first Beer’s law standard solution in the Spectrophotometer. Start data collection. After the absorbance reading stabilizes, tap Keep. Enter the concentration of the solution and select OK.
- Place your second standard sample in the Spectrophotometer. After the absorbance readings stabilize, tap Keep. Enter the concentration of the second sample and select OK.
- Repeat Step 5 for the remaining standard samples. After you have tested the final standard, tap the Stop button to end data collection.
- To calculate a best fit line equation for your standards, choose Curve Fit from the Analyze menu. Select Linear for the Fit Equation, and then select OK. The graph screen will appear again with the linear regression equation displayed.
- Place a cuvette containing an unknown sample of solution in the Spectrophotometer. Tap the Meter tab and write down the displayed absorbance value. Tap the Graph tab and choose Interpolate from the Analyze menu. Trace the linear regression equation to determine the concentration of the unknown.
Measurement vs. Time (Kinetics)
- Generate a spectrum as described above. On the Meter screen, tap Mode. Change the data-collection mode to Time Based.
- You can change the rate, interval, and/or duration of time of data collection, if desired. Select OK when you are ready to proceed.
- A message will appear warning you to either save or discard the full spectrum run. Make your choice and proceed with data collection.
- Mix the reactants, transfer ~2 mL of the reaction mixture to a cuvette and place the cuvette in the Spectrophotometer. Start data collection. You may tap the Stop button to end data collection early.
- To calculate a function for your data, choose Curve Fit from the Analyze menu. Select the Fit Equation, and then select OK. The graph screen will appear again.
Measure an Emission Spectrum with LabQuest
You may use your Spectrophotometer to measure the emission spectrum of a light source such as an LED or a gas discharge tube. To do so, you will need to purchase an optical fiber assembly (order code: VSP-FIBER).
Measure Intensity of Light Emissions
- Insert the Spectrophotometer Optical Fiber into the Fluorescence/UV-VIS Spectrophotometer.
- Aim the tip of the optical fiber at a light source. Start data collection. Tap the Stop button to end data collection. Note: The Spectrophotometer is not calibrated for measuring intensity.
If the spectrum maxes out (flat and wide peaks at a value of 1), increase the distance between the light source and the tip of the optical fiber cable or reduce the sample time (see Change the Settings in LabQuest below).
To increase the sample time, or if data collection is unusually slow, choose Set Up Sensors ► Spectrophotometer: 1 from the Experiment menu. Set the Sample Time (begin with 75 ms, with subsequent reductions by 20 ms) to a suitable value and decrease the Samples to Average to 1.
Change the Settings in LabQuest
The Data Collection Screen in LabQuest lists all the settings for the device. To display this box choose Sensors ► Data Collection from the Meter screen.
For most experiments, the default settings work well.
There are five parameters listed in the dialog box.
- Sample Time: This is similar to the shutter speed of a camera. LabQuest automatically selects the proper sample time during calibration. Note: For emission studies, you may need to change the sample time manually.
- Wavelength Smoothing: This is the number of adjacent readings on either side of a given value that is used to calculate an average value. Note: Be careful adjusting this parameter as it may shift your wavelength values slightly.
- Samples to Average: This is the number of readings taken at a given wavelength to calculate an average reading.
- Wavelength Range: The range is determined by the type of Spectrophotometer in use.
Using the Product with Logger Pro
Consider using Spectral Analysis, the free app dedicated to spectroscopy. To proceed with Logger Pro, connect the sensor following the steps in the Getting Started section of this user manual.
Select the Type of Data (or Units) You Want to Measure
There are three general types of data collection that measure absorbance or transmittance—absorbance (or %T) vs. wavelength, which produces a spectrum, absorbance (or %T) vs. concentration for Beer’s law experiments, and absorbance (or %T) vs. time for kinetics experiments.
The default data type is absorbance. If you want to measure the absorbance of a solution, proceed directly to the Calibrate section below.
If you want to measure %T or intensity, do the following:
- Choose Change Units ► Spectrophotometer from the Experiment menu.
- Select the unit or data type you wish to measure.
Calibrate (Optional if Measuring Intensity)
- To calibrate the Spectrophotometer, choose Calibrate ► Spectrophotometer from the Experiment menu. Note: For best results, allow the Spectrophotometer to warm up for a minimum of ten minutes.
- Fill a cuvette about 3/4 full with distilled water (or the solvent being used in the experiment) to serve as the blank. After the Spectrophotometer has warmed up, place the blank cuvette in the Spectrophotometer. Align the cuvette so the clear side of the cuvette is facing the light source.
- Follow the instructions in the dialog box to complete the calibration, and then click
 .
.
Collect Data with Logger Pro
Measurement vs. Wavelength (Generate a Spectrum)
- Fill a cuvette about 3/4 full of a sample of the solution to be tested. Place the sample in the Spectrophotometer and click
 . Click
  to end data collection.
 - To store the spectrum data, choose Store Latest Run from the Experiment menu.
Measurement vs. Concentration (Beer’s Law Studies)
- Generate a spectrum as described above.
- Click the Configure Spectrophotometer Data Collection button,
 .
.
There are three regions in this box:
- Collection Mode The three options for data collection are offered. If the measurement (Absorbance in this example) vs. Time or vs. Concentration is selected, a wavelength or wavelengths will need to be chosen.
- Graph The graph displays a full-spectrum analysis of the sample in the cuvette holder. By default, the wavelength with the maximum measured value will be selected. You may wish to choose a different wavelength by tapping on the graph or selecting wavelength(s) from the list.
- List of wavelength options This column lists all the available wavelengths. It becomes active when either the Concentration or Time mode is selected.
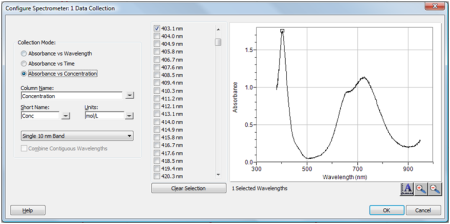
- Select Absorbance (or %T) vs. Concentration as the data-collection mode. The wavelength with the maximum value from the spectrum (λ max) will be automatically selected. There are three options when choosing a wavelength (or wavelengths) for subsequent measurements.
- Option 1 The default option is to use a single 10 nm band. This measures the average absorbance from ~5 nm on either side of the chosen wavelength. You can change the center wavelength value by clicking on the graph or by choosing a wavelength from the list.
- Option 2 If you wish to use the λ max chosen by Logger Pro, but you want the absorbance to be measured only at that one wavelength, change Single 10 nm Band to Individual Wavelengths. You may then select up to ten wavelengths to measure at the same time.
- Option 3 If you wish to measure an average over a range of contiguous wavelengths of your choice, change Single 10 nm Band to Individual Wavelengths. Click
 . Select boxes in the list or drag your cursor on the graph to select up to ten contiguous wavelengths. Check Combine Contiguous Wavelengths.
- Click to continue.
- Click . Place your first sample in the cuvette slot of the Spectrophotometer. After the readings stabilize, click
 . Enter the concentration of the sample and click .
 - Place your second sample in the cuvette slot. After the readings stabilize, click . Enter the concentration of the second sample and click .
- Repeat Step 6 for the remaining samples. When finished, click
 to end data collection.
 - Click Linear Fit,
 , to see the best fit line equation for the standard solutions.
 - If doing Beer’s law to determine the concentration of an unknown, place the unknown sample in the cuvette holder. Choose Interpolation Calculator from the Analyze menu. A helper box will appear, displaying the absorbance and concentration of the unknown. Click .
Measurement vs. Time (Kinetics)
- Generate a spectrum as described above.
- Click the Configure Spectrophotometer Data Collection button, .
- Select Absorbance vs. Time as the data-collection mode. The wavelength of maximum absorbance will be selected. Click to continue or select a wavelength on the graph or in the list of wavelengths. See the previous section for more details.
- The default settings are 1 sample per second for 200 seconds. To change the data-collection parameters for your experiment, choose Data Collection from the Experiment menu and make the necessary changes. Click
 .
. - Mix the reactants. Transfer ~2 mL of the reaction mixture to a cuvette and place the cuvette in the Spectrophotometer. Click . Click if you wish to end data collection early.
- Click Curve Fit,
 , to calculate a function for your data.
Measure Emission Spectra with Logger Pro
You may use your Spectrophotometer to measure the emission spectrum of a light source such as an LED or a gas discharge tube. To do so, you will need to purchase an optical fiber assembly (order code: VSP-FIBER).
Measure Intensity of Light Emissions
- Insert the Spectrophotometer Optical Fiber into the Fluorescence/UV-VIS Spectrophotometer.
- Aim the tip of the optical fiber cable at a light source. Click . Click to end data collection. Note: The Spectrophotometer is not calibrated for measuring intensity.
If the spectrum maxes out (flat and wide peaks at a value of 1), increase the distance between the light source and the tip of the optical fiber cable or reduce the sample time (see Change the Settings in Logger Pro).
To increase the sample time, or if data collection is unusually slow, choose Set Up Sensors ► Spectrophotometer: 1 from the Experiment menu. Set the Sample Time (begin with 75 ms, with subsequent reductions by 20 ms) to a suitable value and decrease the Samples to Average to 1.
Use the Stored Emissions Files in Logger Pro
Logger Pro contains a folder of emissions graphs from selected discharge tubes, including: argon, helium, hydrogen, mercury, oxygen, sodium, and xenon. You can display and analyze these graphs without a spectrometer connected to your computer. Follow these steps to view one of these graphs.
- Choose Open from the File menu.
- Open the Sample Data folder.
- Inside the Sample Data folder, open the Physics folder.
- Inside the Physics folder, open the Gas Discharge Spectra. Open the desired file.
You can use the mercury emissions graph to test fluorescent lighting for the presence of mercury.
Change the Settings in Logger Pro
The Spectrophotometer dialog box lists all the settings for the device. To display this box choose Set Up Sensors ► Spectrophotometer from the Experiment menu.
For most experiments, the default settings work well.
There are five parameters listed in the dialog box.
- Sample Time: This is similar to the shutter speed of a camera. Logger Pro automatically selects the proper sample time during calibration. Note: For emission studies, you may need to change the sample time manually.
- Wavelength Smoothing: This is the number of adjacent readings on either side of a given value that is used to calculate an average value. Note: Be careful adjusting this parameter as it may shift your wavelength values slightly.
- Samples to Average: This is the number of readings taken at a given wavelength to calculate an average reading.
- Wavelength Range: The range is determined by the type of Spectrophotometer in use.
By clicking on the picture of the Spectrophotometer in this dialog box, you will gain access to four options: calibrate, configure data collection, go to the support website, and units of measure. Click on an item to select it.
Specifications
|
Detection modes |
Absorbance, % Transmittance, Raw Lamp Output, and Intensity (fiber required) |
|
Dimensions |
18.5 cm × 17 cm × 7 cm |
|
Power supply |
AC adapter (included) |
|
Power consumption |
3 A start-up, 500 mA continous |
|
Absorbance light source |
Deuterium (UV) and Incandescent (VIS) |
|
Detector |
Linear CCD |
|
Wavelength range |
220 nm–850 nm |
|
Wavelength reporting interval |
~1 nm |
|
Optical resolution |
3.0 nm (as determined with 486 nm hydrogen emission spectral line FWHM) |
|
Wavelength accuracy |
± 2.0 nm (as determined with holmium oxide NIST standard) |
|
Absorbance photometric accuracy |
± 5.0% (as determined with potassium dichromate NIST standards) |
|
Typical scan time |
~2 s |
|
Sample format |
10 mm × 10 mm cuvette (UV quartz cuvette included) |
|
Beam height (z dimension) |
8.5 mm |
Safety
-
Always wear UV blocking safety glasses or goggles when using this device. The light source emits ultraviolet radiation and can cause eye damage.
- When this instrument is in data-collection mode labeled Intensity, the light source will be blocked or turned off. Continue to use proper safety precautions.
-
This instrument contains an internal high-voltage power source. Position the instrument where the ON/OFF switch can be easily reached. Do not move the instrument when it is running. Do not attempt to open or remove the case at any time.
- Do not remove or modify any of the installed safety components of this device. Doing so will create an unsafe operating condition and will void the product warranty.
- No user-serviceable parts are in this device. Do not attempt to open or modify this device. Contact Vernier for all repairs and service including lamp replacement.
- Handle the device with care. This instrument can be damaged if it is dropped.
- Do not use this instrument if it is damaged in any way. Contact Vernier Technical Support for troubleshooting and technical assistance.
- Do not use this instrument for clinical or diagnostic procedures.
Troubleshooting
- For best results, the absorbance values for all samples must be between 0.1 and 1.0 absorbance units at all wavelengths.
- Make sure you are using UV-VIS compatible cuvettes if you choose not to use the enclosed quartz cuvettes.
Find troubleshooting tips here: www.vernier.com/til/3044
Repair Information
- The UV light source in the Vernier UV-VIS Spectrophotometer is a deuterium lamp. The lifetime of this source is rated at approximately 1000 hours. Lifetime is defined as the amount of time it takes the lamp to decrease to 50% of its original output. Deuterium lamp life is also inversely proportional to the number of ignitions, so it is best to limit the number of times you ignite the bulb if you wish to prolong its life.
- The deuterium lamp is covered by a one-year warranty or 1000 hours, whichever comes first.
- Contact Vernier for all repairs and service including lamp replacement
- No user-serviceable parts are in this device. Do not attempt to open the case of the device. Do not attempt to change or repair the lamp. Doing so will create an unsafe operating condition and will void the product warranty.
If you have watched the related product video(s), followed the troubleshooting steps, and are still having trouble with your Vernier UV-VIS Spectrophotometer, contact Vernier Technical Support at support@vernier.com or call 888-837-6437. Support specialists will work with you to determine if the unit needs to be sent in for repair. At that time, a Return Merchandise Authorization (RMA) number will be issued and instructions will be communicated on how to return the unit for repair.
Accessories/ Replacements
| Item | Order Code |
|---|---|
|
CUV-RACK |
|
|
CUV-QUARTZ |
|
|
VSP-FIBER |
|
|
CB-USB-MINI |
|
| Replacement Power Supply for Ultraviolet Range (UV-VIS) Spectrophotometers |
VSP-UV-PS |
Warranty
Vernier warrants this product to be free from defects in materials and workmanship for a period of five years from the date of shipment to the customer. This warranty does not cover damage to the product caused by abuse or improper use. This warranty covers educational institutions only. The light source is covered for one year.
Contact Support
Fill out our online support form or call us toll-free at 1-888-837-6437.