When the pandemic forced instruction at Portland State University to go remote, Dr. Thomas Hancock had to quickly make adjustments to his 300-level human anatomy and physiology labs. “Traditionally, students work in small groups and have access to a lot of hands-on technology,” he said. “Transitioning to an online format we wanted to try and keep it simple, but still engaging.”
Going Remote
Dr. Hancock developed a new remote lab format in which the lab teaching assistant acts as the subject—demonstrating the experiment in real time—and the class works together as one large lab group analyzing the data from the experiment. “It’s not completely perfect, but it’s worked well,” said Hancock. “It was nice to only have to distribute the equipment to the teaching assistant.”
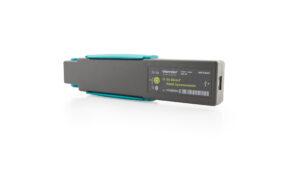
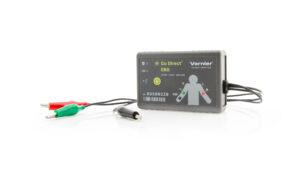
In the “Muscle Fatigue: Force Production and Electromyography” physiology lab created by Dr. Hancock, the teaching assistant uses the Vernier Go Direct® Hand Dynamometer and Go Direct EKG sensors to demonstrate extended force production by muscles and muscle fatigue, as well as electrical activity within the muscle using electromyography. Students then use the Graphical Analysis Pro app to analyze the data collected to help understand the principles of skeletal muscle force production and fatigue. Students also study how force production correlates with the EMG signal and how force decreases during fatigue. Finally, students identify the muscles that are being monitored with these techniques.
“In addition to teaching students about key physiology concepts, the goal is to really have the students work with and interpret the data,” said Hancock. “We want our students to be prepared to understand graphs and data in the real world, and Graphical Analysis Pro is helping them to do that.”
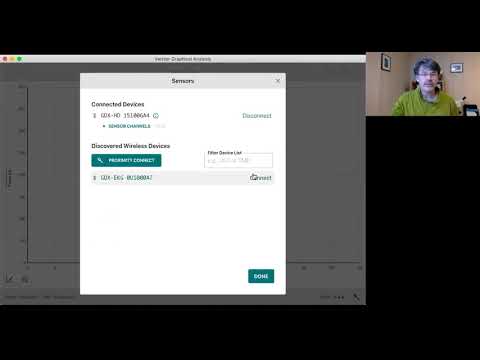
The Graphical Analysis Pro app offers the ability to perform live experiments and share that data over the internet in real time, and it allows educators and students to easily insert, view, and sync a video to sensor data for analysis. Whether learning is happening remotely or in person, students can experience real experiments, think critically as they analyze and graph data, and connect abstract concepts to real-world applications.
“Graphical Analysis Pro was very plug and play and really intuitive to set up,” said Hancock. “When we first implemented it, we were up and running with data in 10 minutes and kind of shocked by how easy it was.”
“This new technology is like driving a Tesla compared to an old Ford,” he added.
Looking Ahead
Dr. Hancock and the Portland State Department of Biology are continuously looking to add more interactive, data-rich labs each week. “We want to really help bridge what students are learning in lecture and make the experience as interactive as possible, even though the labs are being done remotely,” said Hancock.
“Graphical Analysis Pro has helped us envision remote teaching a little better,” he added. “Being able to share data instantaneously online and have the students analyze it themselves has opened up a lot of opportunities for what’s possible.”
About the Educator
Dr. Thomas Hancock
Portland State University
Portland, OR
Dr. Thomas Hancock works in the Department of Biology at Portland State University as the coordinator for the human anatomy and physiology series. In addition to being a research scientist, he has taught for more than 20 years, including the last seven years at Portland State, his alma mater.
Learn More About:
Graphical Analysis Pro
Go Direct Hand Dynamometer
Go Direct EKG