Sharing ideas and inspiration for engagement, inclusion, and excellence in STEM
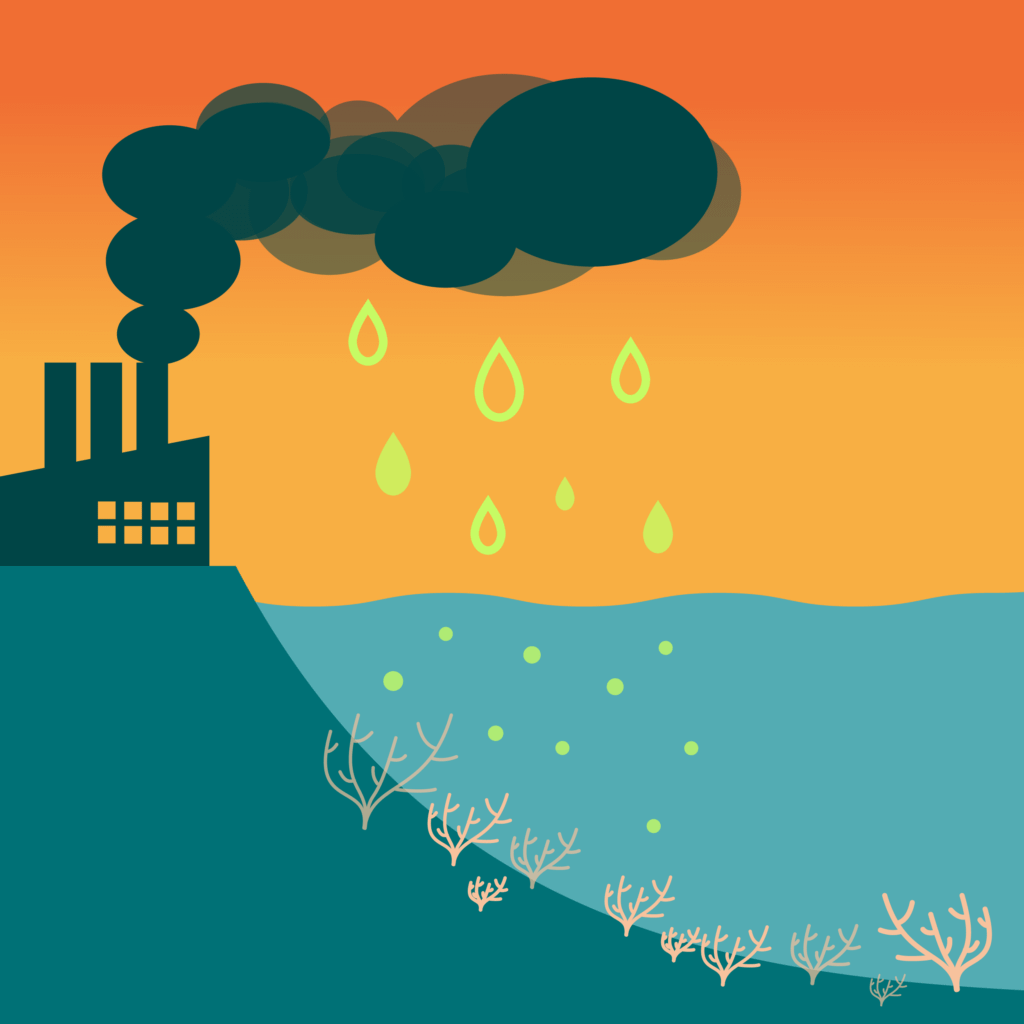
Today’s environmental challenges call for ongoing discussions and hands-on learning opportunities to deepen student understanding and engagement in environmental stewardship. One such activity is to investigate how the burning of fossil fuels not only contributes to climate change, but also leads to changes in environmental chemistry, such as the increase in ocean acidification and subsequent increase in acid rain.
The Connection Between Fossil Fuels and Ocean Chemistry
The combustion of fossil fuels releases a cocktail of gases into the atmosphere, including carbon dioxide (CO2), sulfur dioxide (SO2), and nitrogen oxide (NO2). While the link between these emissions and climate change is well documented, their impact on the world’s oceans is equally concerning but less visible.
Oceans act as a carbon sink, absorbing CO2 from the atmosphere. However, the excessive amounts of CO2 resulting from human activities leads to a notable decrease in water pH, making the oceans more acidic. This acidification can have detrimental effects on marine life and ecosystems, disrupting the delicate balance that sustains the ocean’s biodiversity.
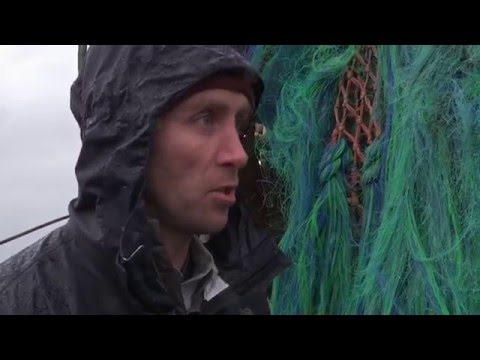
Help your students contextualize the impact of ocean acidification with this video exploring how students, scientists, and fishermen from Washington’s Olympic Peninsula coast are responding to changing marine ecosystems.
A Hands-On Experiment to Illustrate Real-Time pH Change
In this experiment, students explore the science behind ocean acidification by using a Go Direct® pH Sensor and Vernier Graphical Analysis® to measure changes in pH and study the effect of dissolved CO2 on the pH of water.
There are a few variations on this experiment, including qualitative demonstrations like having students blow bubbles through a straw in a water sample or quantitative experiments that use Alka Seltzer® or dry ice to introduce excess CO2. One of the benefits of this particular variation is that using a paraffin candle more accurately models the reality of how power plants, exhaust from combustion engines, and other human activities produce a mix of gases in the atmosphere.
Essentials for this Experiment
- Chromebook™, computer, or mobile device
- Vernier Graphical Analysis app
- Go Direct pH Sensor or Go Direct Tris-Compatible Flat pH Sensor
- Faucet vacuum aspirator
- Vacuum flask and tubing
- Stopper modified to fit flask and hold pH probe and plastic tubing
- Glass funnel
- Candle
- Matches or lighter
- Ring stand and clamp (2)
- Distilled water
- Acid/base indicator (optional)
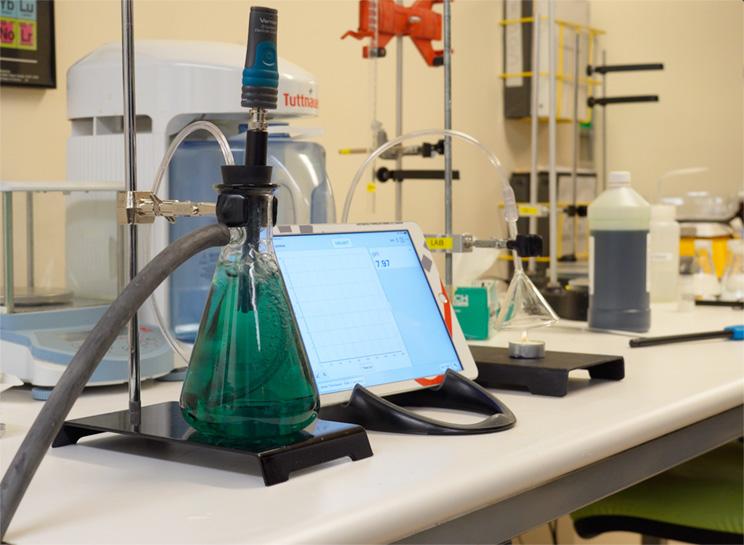
The Setup
Prepare your lab setup near a sink. Start by soaking your pH sensor in a pH 7 solution while you prep the lab so that the sensor has a quicker response time. Connect the vacuum aspirator to the faucet along with the tubing for the vacuum flask.
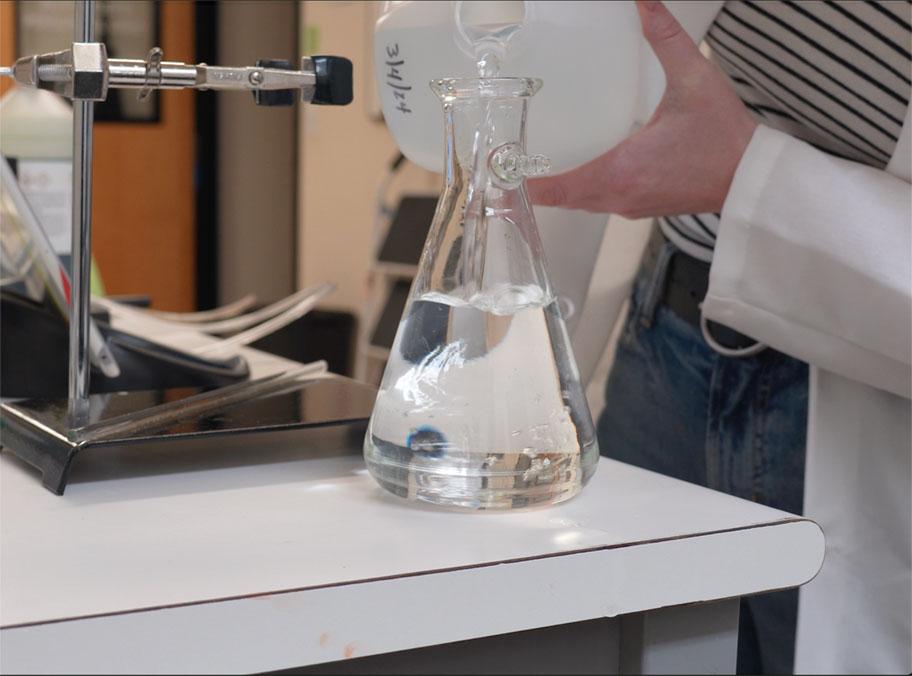
Fill the vacuum flask with distilled water and add a universal indicator if desired. We recommend including the indicator to help students visualize the qualitative change in acidity alongside the quantitative data being collected by the sensor. Secure the flask to the ring stand. Carefully fit the tubing to the flask.
On a second ring stand, set up the glass funnel over the candle. Thread the plastic tubing from the funnel as well as the pH sensor through the modified stopper. Insert both the tubing and tip of the probe into the vacuum flask, ensuring that the tip of the probe is fully submerged in the water sample and that the stopper creates an airtight seal.
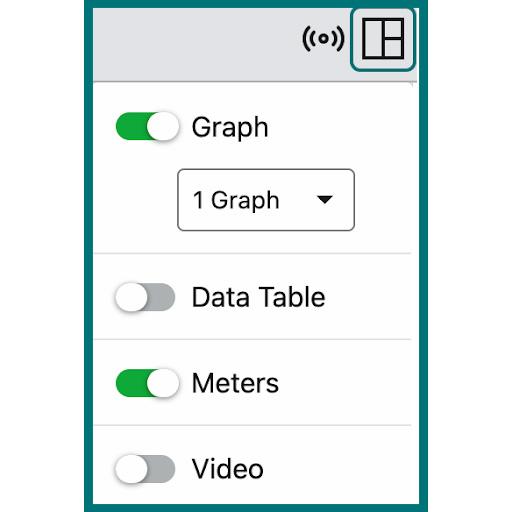
Connect the pH probe via Bluetooth® wireless technology or USB to your device and launch Vernier Graphical Analysis.
Conducting the Experiment
Encourage students to make predictions about what they think will happen when air is introduced through the tubing and when the candle’s combustion gases mix with the water. Will the pH change? In which direction? What will that mean about the acidity of the water?
Turn on the faucet and start data collection in Graphical Analysis. Allow 10–20 seconds for the pH sensor to reach equilibrium, and then light the candle under the glass funnel. As the candle burns, it mimics the pollutants from fossil fuel combustion entering the ocean. These gases dissolve in the water, forming acids and lowering the pH. This real-time data visualization allows students to witness the impact of pollution on ocean chemistry firsthand.
Experiment Tips
- To make the experiment even more illustrative of the impact on the natural environment, try using different water samples, including ocean water and locally sourced fresh water.
- This experiment can also be conducted using a LabQuest® interface in lieu of Graphical Analysis and a laptop or mobile device.
- If your data is inconsistent, use this as an opportunity to interrogate why that might be!
Discussion Questions
Following the experiment, discuss student observations and their broader environmental implications.
- How does this experiment reflect the natural process of ocean acidification?
- How might the increased acidity in the ocean correlate to an increase in acid rain?
- What might be the impact of increased ocean acidity on marine ecosystems?
- How can we, as individuals and communities, reduce our carbon footprint?
Looking for more ways to engage students in environmental science explorations? Explore our resources. Questions? We’re always here to help! Reach out to chemistry@vernier.com or call 888‑837‑6437.
Share this Article
Related Articles


Sign up for our newsletter
Stay in the loop! Beyond Measure delivers monthly updates on the latest news, ideas, and STEM resources from Vernier.