
Sharing ideas and inspiration for engagement, inclusion, and excellence in STEM
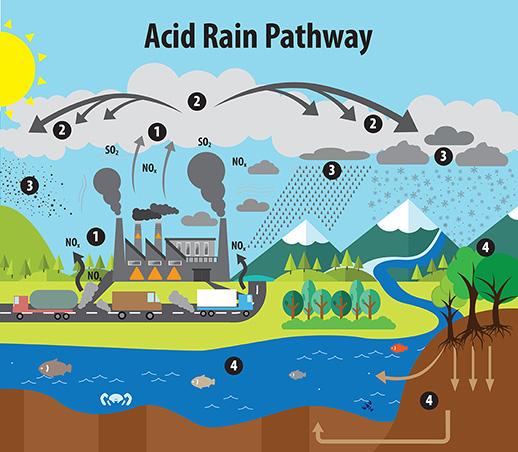
National Chemistry Week runs October 18–24, and this year’s theme, Chemistry of Construction, is a natural fit for studying acid rain. Acid rain forms when atmospheric gases like sulfur dioxide, nitrogen dioxide, and carbon dioxide react with water, and it does measurable damage to the concrete and limestone used in construction.
Exploring this connection helps students master core concepts—including synthesis reactions, acid-base chemistry, and logarithmic pH scales—while exploring modern, real-world environmental issues:
- A Global Policy Success Story: The U.S. Clean Air Act Amendments of 1990 introduced a cap-and-trade system for SO2 emissions, cutting regional acid deposition by 80–90%. It serves as proof that environmental legislation works.
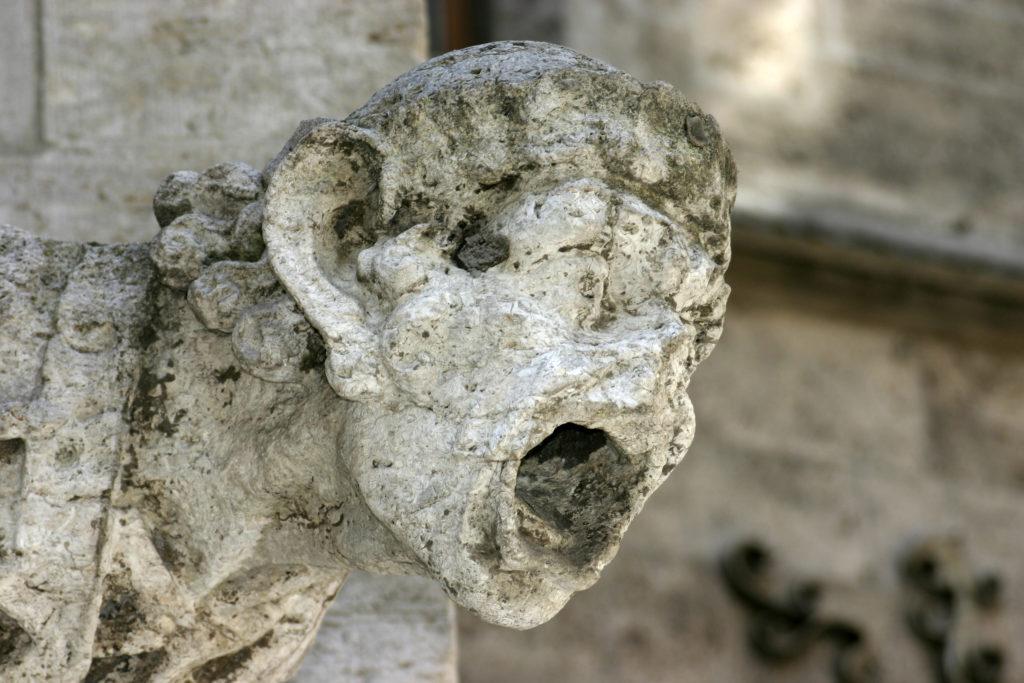
- Infrastructure & Heritage Degradation: Acid rain accelerates the chemical weathering of marble, limestone, and mortar (CaCO3) through neutralization reactions, turning them into water-soluble gypsum. This threatens global landmarks like the Acropolis, the Taj Mahal, Chichen Itza, the Colosseum and Roman monuments, and various National Monuments throughout the US.
- Ecological Lag Times & Soil Chemistry: Ecosystems don’t recover overnight. High-elevation forests in the U.S. Northeast and mountain lakes still bear the scars decades later. Meanwhile, rapid industrialization without strict controls continues to trigger severe acid deposition across developing regions in Asia and South America, affecting food security, crop yields, and local ecosystems.
Acid rain brings abstract chemical equations to life, showing students how the chemistry on their lab benches shapes history, policy, and global ecosystems.
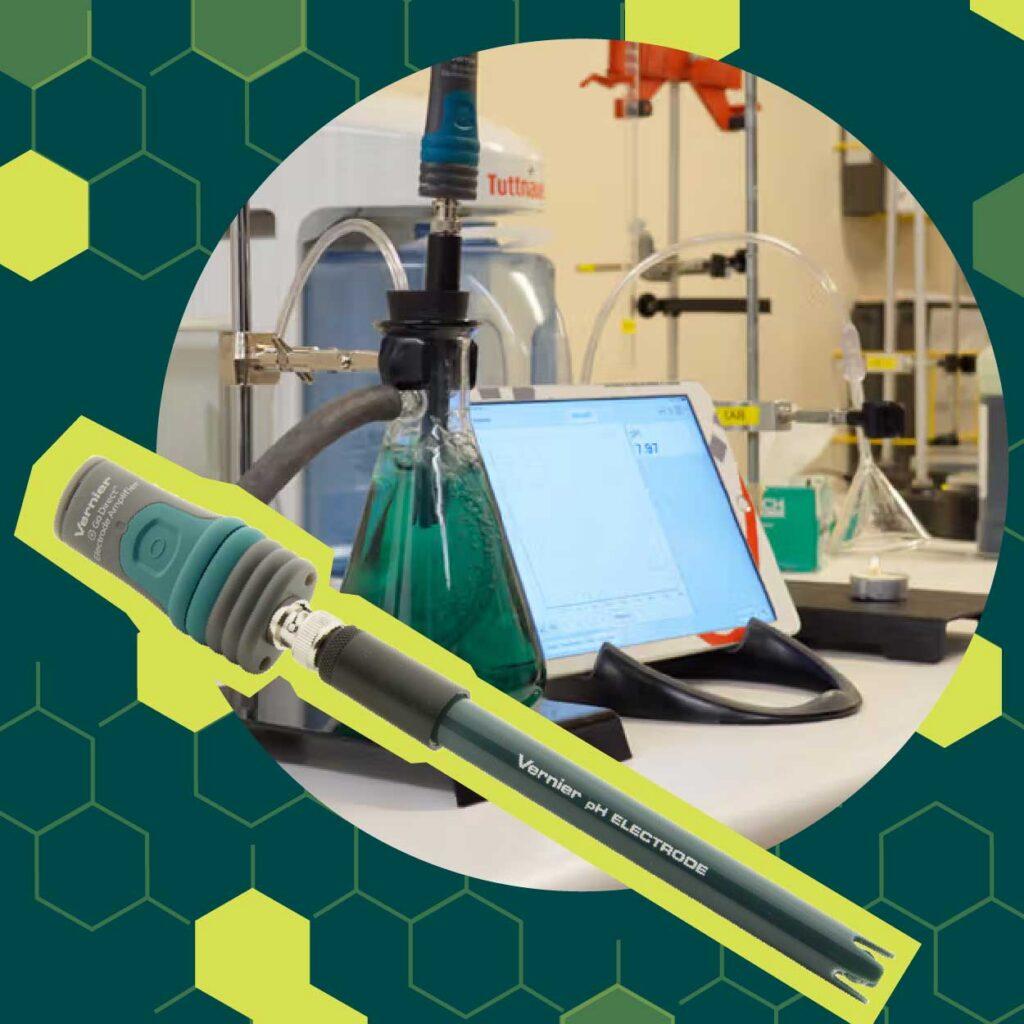
The popular Fish Kill experiment in Forensic Chemistry Experiments has students simulate the formation of acid rain and use the Go Direct® pH Sensor and Vernier Graphical Analysis® to explore the acidification of a fictional lake.
Why Explore Acid Rain?
Synthesis reactions are often taught as a classification of chemical reactions, but binary nonmetal oxides reacting with water provide students an opportunity to explore how these reactions can contribute to environmental phenomena.
CO₂, SO₂, and NO₂ can be found in the atmosphere from natural and human-related sources. The webinar Synthesis in the Sky: How SO₂, NO₂, and CO₂ Become Acid Rain highlights these gases as useful examples because they connect the chemistry of nonmetal oxides and water to environmental concerns and combustion.
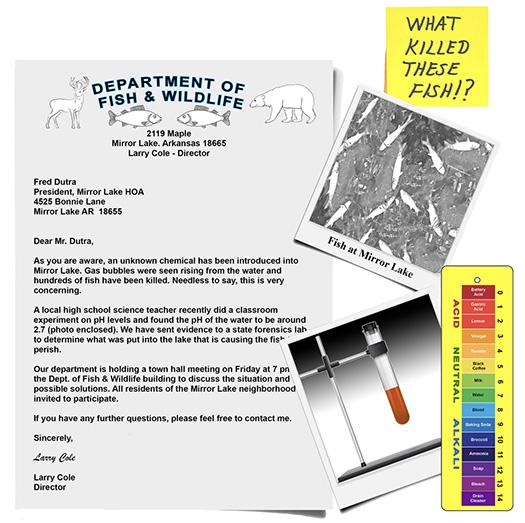
In the Fish Kill experiment, students generate these gases themselves in microscale, bubble them through water, and measure what happens. Students observe the resulting changes in pH, then use their data as evidence to support a conclusion about which gas may have caused the lake’s acidification.
The Chemistry Behind the Investigation
When nonmetal oxide gases react with water, they form acids. These nonmetal oxides are known as acidic anhydrides.
CO₂(g) + H₂O(ℓ) → H₂CO₃(aq)
carbonic acid
SO₂(g) + H₂O(ℓ) → H₂SO₃(aq)
sulfurous acid
2NO₂(g) + H₂O(ℓ) → HNO₃(aq) + HNO₂(aq)
nitric acid and nitrous acid
Once the acids form in water, they dissociate and produce hydronium ions. Students use the relationship between pH and hydronium concentration to quantify the change:
pH = −log[H₃O⁺]
This can be rearranged to:
[H₃O⁺] = 10⁻ᵖᴴ
In this experiment, rather than simply observing that the water became more acidic, students can calculate the concentration of hydronium ions associated with the pH they measured.
Experiment Setup
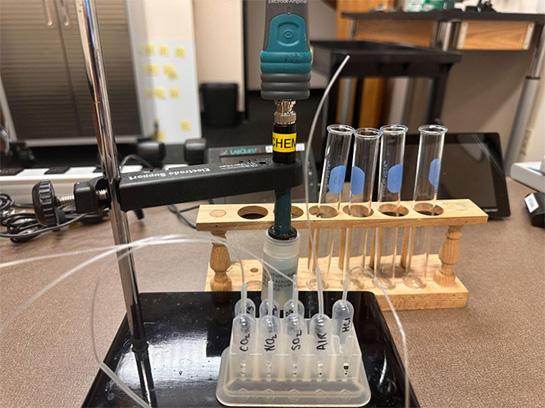
What You’ll Need
- Go Direct pH Sensor
- Graphical Analysis app
- Chromebook, computer, or mobile device
- Stir Station
- Test tubes and test-tube rack
- 1 Beral pipet, narrow stem, containing 1.0 M HCl
- 3 Beral pipets with a 2-cm standard stem
- 4 Beral pipets with a 20-cm narrow stem
- Sodium bicarbonate (NaHCO₃)
- Sodium bisulfite (NaHSO₃)
- Sodium nitrite (NaNO₂)
- 400 mL, 250 mL, and 100 mL beakers
- 10 mL graduated cylinder
- Buret clamp
- Wash bottle with distilled water
- Waste container or beaker
- Goggles
- Marker
The investigation can be completed in approximately one 45- to 60-minute class period.
Note on the microscale setup: Students generate very small quantities of CO₂, NO₂, and SO₂ using pipets. Hydrochloric acid is added to the sodium salts to generate the gases, which are then collected and introduced into water containing the pH sensor.
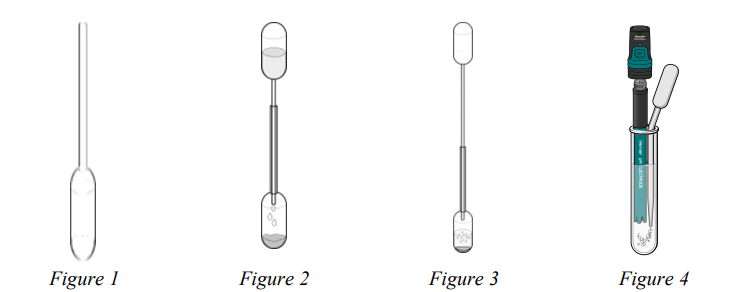
Figure 1: Prepare an empty pipet.
Figure 2: Add HCl to non-metal oxide.
Figure 3: Collect gas.
Figure 4: Add gas to water.
The microscale approach keeps the quantities of gas small while allowing students to directly investigate gases they might otherwise only encounter through equations, diagrams, or demonstrations.
Important: Review the instructor materials and applicable Safety Data Sheets before conducting this experiment. The materials include specific hazard information for hydrochloric acid and the chemicals used to generate the gases.
Pre-Lab: Predicting the Effects of Nonmetal Oxides
Before beginning the investigation, students can research what pH range can be harmful to fish and justify their response.
They can also write balanced chemical equations for producing CO₂, NO₂, and SO₂ from sodium bicarbonate, sodium nitrite, and sodium bisulfite reacting with hydrochloric acid. This gives them an opportunity to connect the chemical reactions used to generate the gases with the reactions they will investigate.
Before collecting data, ask students to make a prediction: Which gas do you think will cause the greatest decrease in pH? Why?
This prediction can be a particularly surprising part of the investigation as students compare their expectations with what they actually observe.
Part I: Measuring the Change in pH
To begin, students add 10 mL of distilled water to a test tube and position the Go Direct pH Sensor in the water. They connect the sensor to Graphical Analysis and set the data collection time to 120 seconds.
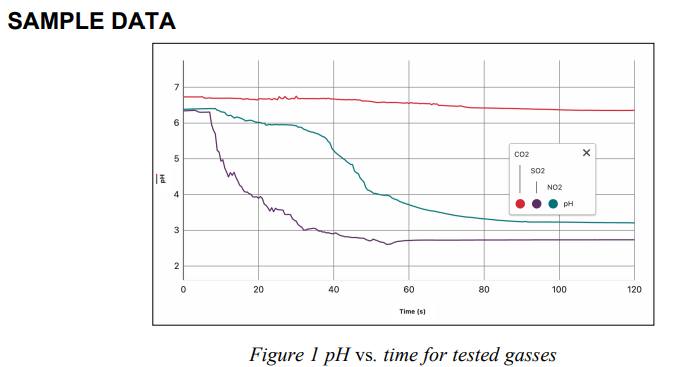
Students first collect a data set using air. They begin data collection and, after 15 seconds, slowly bubble air through the water. Students then determine the initial pH and final pH after the pH stabilizes.
They repeat the process using CO₂, NO₂, and SO₂, recording the pH values for each trial.
Each trial produces a pH vs. time data set that students can examine and compare.
Practical tip: Because measuring the pH of distilled water can be difficult, it is recommended to pre-treat the pH sensors by soaking them in a pH 7 solution before starting the investigation. This can help make the readings more consistent. Place the pH probe to the pH 7 solution between runs. After the experiment, return the probes to the usual pH storage solution.
Part II: Comparing the Data
Once students have collected all four data sets, they can analyze all of their data within Graphical Analysis.
Students determine the highest and lowest pH values for each trial and calculate the change in pH:
ΔpH = initial pH − final pH
They can then compare the magnitude of the pH changes produced by air, CO₂, NO₂, and SO₂. And, with their data, they can determine which gas produced the greatest change.
Post-Lab Analysis
Students can take their analysis one step further by using their lowest pH measurement to calculate the concentration of hydronium ions. For example, if the lowest pH is 5.386:
[H₃O⁺] = 10⁻⁵·³⁸⁶ = 4.11 × 10⁻⁶ mol/L
Students perform calculations for each gas and compare the resulting concentrations. The relationship will show that as pH decreases, hydronium ion concentration increases.
With their new conceptual understanding, students can then return to and answer the original question: Which gas could have caused the acidification of Mirror Lake?
Their conclusion should be supported by the pH data and concentration calculations rather than simply by recalling which gas is associated with acid rain.
To take analysis one step further, ask students to consider how an acidified lake could be neutralized. Students can do this by exploring how calcium carbonate in limestone can react with acids in the water. They can use their calculated acid concentration, the volume of a hypothetical 200-million-gallon lake, and a balanced chemical equation to determine the mass of calcium carbonate needed for neutralization.
Practical Tips
- Soak the pH sensor in a pH 7 buffer before class. This can help produce more consistent readings when students begin each trial with distilled water.
- Rinse test tubes between trials. Have students rinse the test tube and reset the water between data collections to help prevent one gas from affecting the next trial.
- Display the data sets together. Graphical Analysis allows students to compare the pH-versus-time runs and identify differences between the gases.
- Encourage predictions before data collection. Students can revisit their predictions after seeing the results and consider why their expectations did or did not match the data.
- Review the safety information carefully. The instructor materials provide specific guidance for preparing the gases, handling hydrochloric acid, ventilation, and disposal.
How It Supports 3D Learning
The Fish Kill investigation gives students sustained practice with several scientific practices and quantitative reasoning skills—students observe chemical reactions, analyze and interpret pH data, apply mathematical representations, and use evidence to support their explanation for what caused the change in pH in Mirror Lake.
The investigation also aligns with NGSS performance expectations HS-PS1-2 and HS-PS1-7, which address explaining the outcomes of chemical reactions and using mathematical representations to support ideas about chemical reactions and conservation of mass.
Want to See It in Action?
Watch the full Synthesis in the Sky: How SO₂, NO₂, and CO₂ Become Acid Rain webinar on demand to see the Fish Kill investigation demonstrated and to learn additional best practice tips. The resource folder includes the student experiment file, instructor notes, sample data, and more to get you started.
Have questions or want to share how it went in your classroom? Reach out at chemistry@vernier.com, call 888‑837‑6437, or drop us a line in the live chat.
Share this Article
Related Articles





Sign up for our newsletter
Stay in the loop! Beyond Measure delivers monthly updates on the latest news, ideas, and STEM resources from Vernier.