
Sharing ideas and inspiration for engagement, inclusion, and excellence in STEM
The first few weeks of school set the tone for the rest of the year. Before students dive into complex investigations, they need opportunities to practice the habits of scientists—asking questions, making predictions, collecting data, and interpreting evidence. They also need time to get comfortable and confident with technology.
Recently, Vernier Trendsetter and high school science teacher Cassie Whitecotton joined Vernier chemistry specialist Nüs Hisim for our webinar, Simple Sensor Experiments to Start the School Year. Together they shared some of their favorite sensor activities that help students build those essential skills from day one.
Whether you teach middle school science, high school chemistry or physics, or introductory college courses, these three investigations are easy to set up, immediately engaging, and designed to build the scientific and technical skills students will rely on all year long.
Teacher Tip: Start Every Investigation with a Prediction
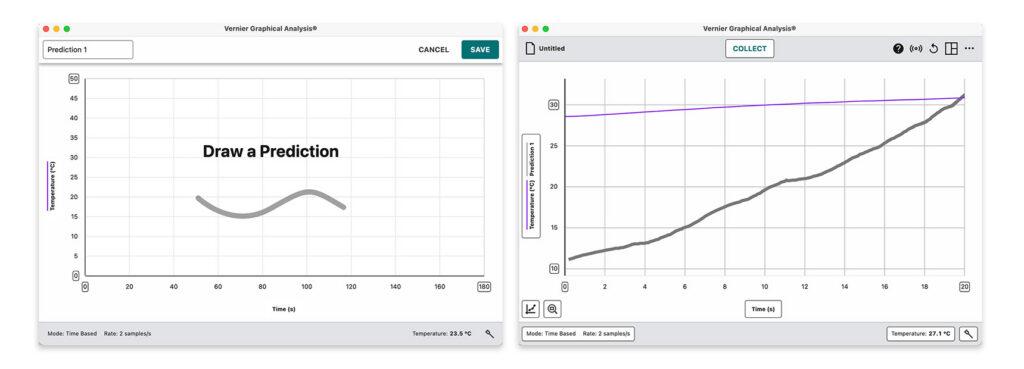
Before students collect a single data point, have them use the Prediction feature in Vernier Graphical Analysis® to sketch what they think their graph will look like. After the investigation, students can compare their prediction with the measured data and discuss what matched their expectations—and what surprised them.
As Whitecotton shared, “I have a rule in my classroom that students have to make a prediction before they collect data. I don’t care if it’s wrong, and I don’t care if it’s right. I just want them thinking about what’s going on.”
The goal isn’t for students to predict the graph perfectly—it’s to give them a reason to think about the investigation before they begin and a starting point for discussing the results afterward.
1. Build Graphing Confidence with the Go Direct Temperature Probe
The Go Direct® Temperature Probe is one of the easiest sensors to introduce because there’s almost no setup involved, and students already intuitively understand temperature from their everyday experiences. It’s a great low‑risk, high‑success way to get any level of student comfortable with probeware, graph interpretation, and the basics of data analysis.
Challenge students to create three different types of graphs:
- A linear graph with a positive rate of change
- A linear graph with a negative rate of change
- A nonlinear graph
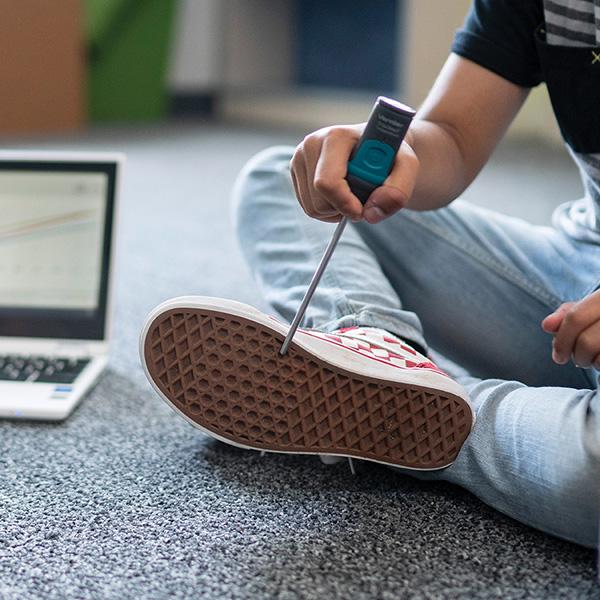
Students quickly discover they can generate different patterns simply by warming the probe with their hands, cooling it with ice water, or experimenting with other classroom materials (a hair dryer, paper towel, etc.). After collecting data, have them calculate the rate of change manually before comparing their results to a linear regression in Graphical Analysis.
Why it works
- Minimal classroom setup
- Immediate visual feedback
- Reinforces graphing and data analysis skills
- Easily adapted for middle school through college courses
Looking for a more structured investigation? Have students compare the warming rates of different hands during the popular A Hot Hand activity and discuss why the graphs differ.
2. Get Students Moving with the Go Direct Motion Detector
Sometimes the best way to understand a graph is to become part of it.
With the Go Direct Motion Detector, students create position versus time graphs simply by walking toward or away from the sensor. As they watch their graphs appear in real time, they begin connecting physical movement to mathematical representations.
Start with simple graphing challenges:
- Walk away from the sensor at a constant speed.
- Walk toward the sensor.
- Change speed midway through the investigation.
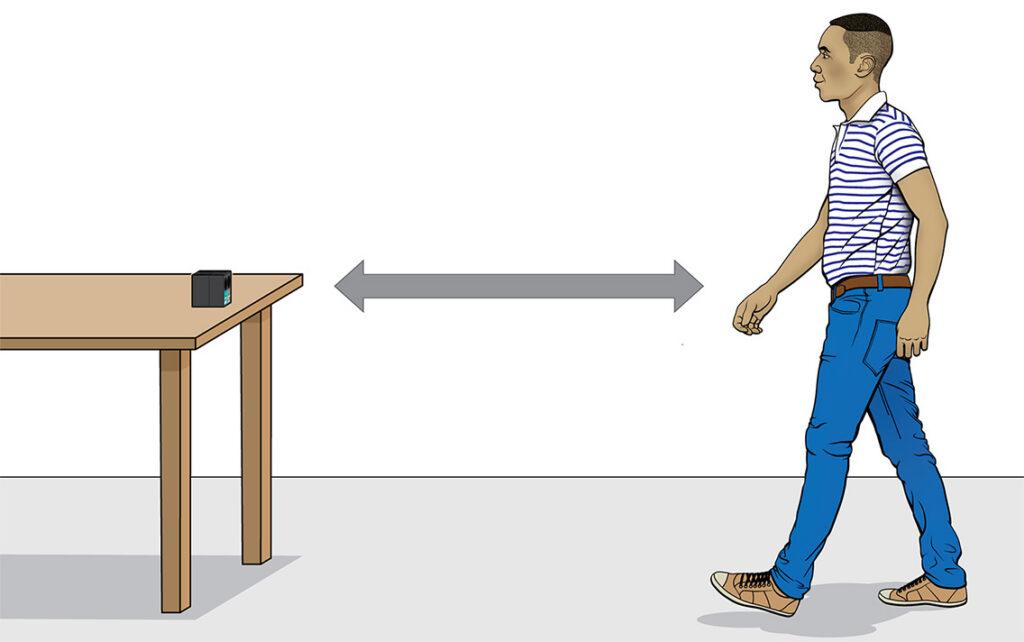
Once students are comfortable interpreting the graphs, encourage them to ask new questions. What happens if you drop a ball? How would an oscillating spring appear? Can you create a graph that matches a partner’s prediction?
These open-ended investigations encourage experimentation while laying the foundation for future lessons on velocity, acceleration, and motion.
Why it works
- Students become active participants in the investigation.
- Graphs update instantly, making cause-and-effect relationships easy to observe.
- Encourages collaboration and scientific discussion.
- Requires very little setup time.
Looking to extend the investigation? The Graph Matching activity gives students a target graph to replicate with their own movement. It’s a structured way to deepen graph interpretation skills and push students to think more precisely about position and velocity.
3. Introduce a New Mode of Data Collection with the Go Direct Pressure Sensor
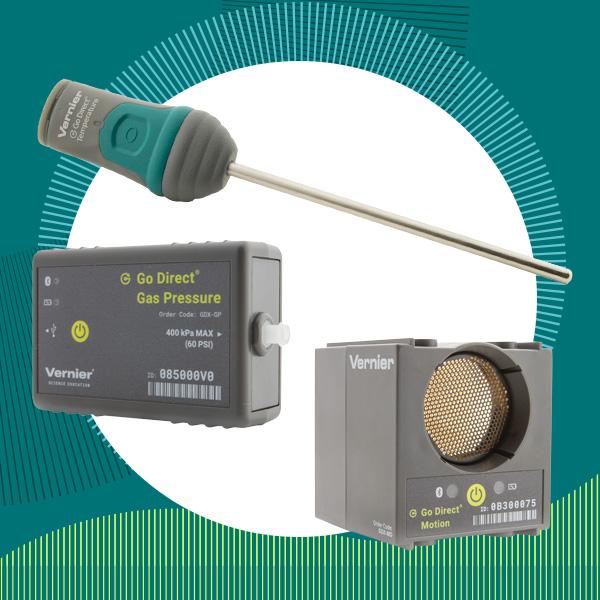
Most students’ first experience with data collection is time-based. They just hit collect and watch their sensor data map against a time x-axis. Go Direct Gas Pressure Sensor is a great early-year opportunity to show them there’s another way, and it’s just as simple to get started.
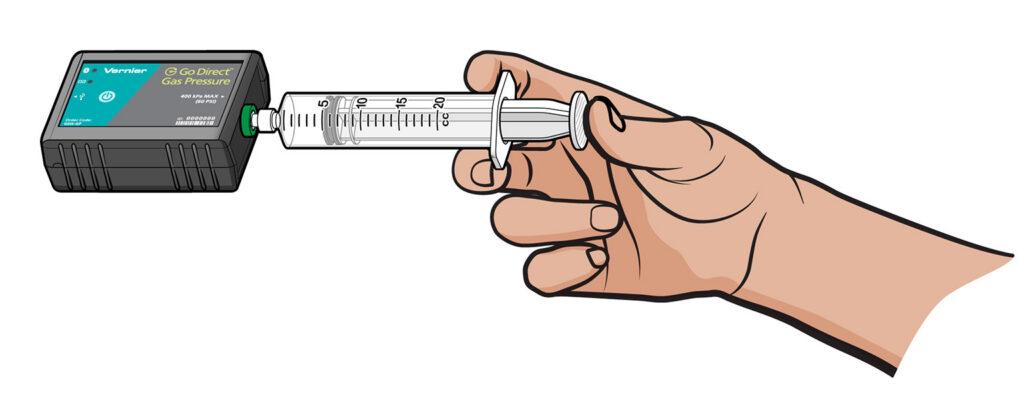
To investigate Boyle’s Law, students connect the pressure sensor to a syringe and record pressure in Graphical Analysis by manually entering volume data in Events with Entry mode. Instead of continuously collecting data points in a live graph, students use the real-time meter to observe pressure measurements and determine when each point is captured. It’s an intuitive shift, and once students understand it, they’ll be ready to use the same approach for titrations, gas law variations, and other non-time-based investigations throughout the year.
The setup requires just the sensor and the included syringe. Students compress and expand the air inside, recording pressure at each volume, then apply different curve fits in Graphical Analysis to determine the relationship between pressure and volume.
Why it works:
- Introduces events-with-entry data collection early, so students are ready to use it all year
- Minimal materials: Just the sensor and the included syringe
- Puts students in control of when and how data is recorded
- Scales from introductory chemistry through AP and college-level courses
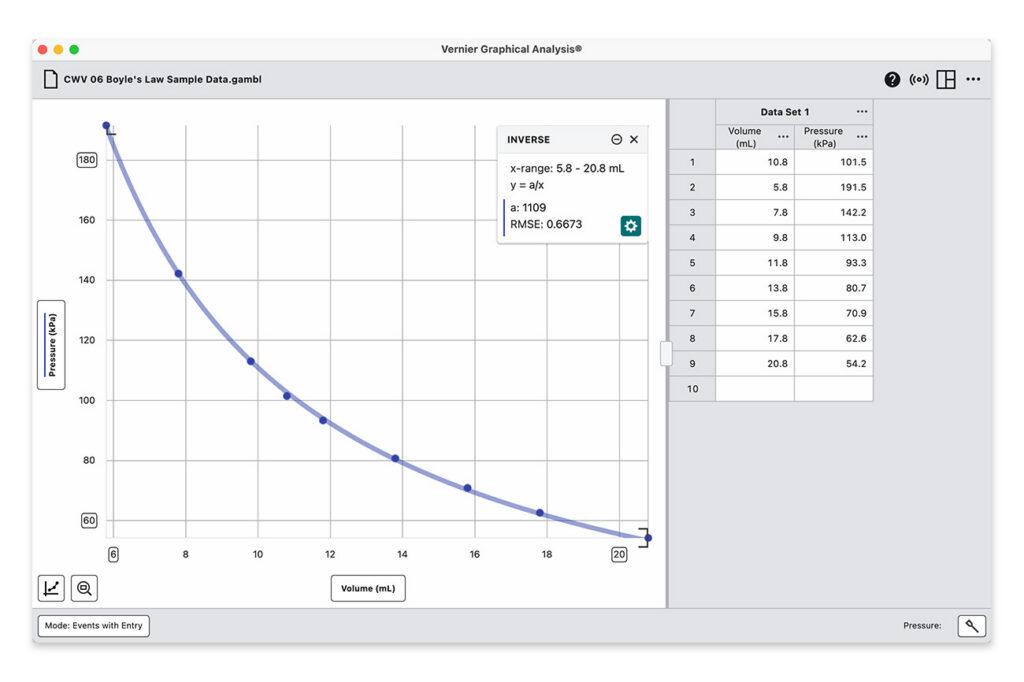
Looking to extend the investigation? Exploring the Properties of Gases walks students through all four gas laws—Boyle’s law, Gay-Lussac’s law, Charles’ law, and Avogadro’s law—using the same sensor and data-collection mode. The events‑with‑entry approach also transfers directly to other core experiments, such as acid-base titrations with Go Direct pH Sensors later in the year.
Build Skills That Last All Year
The first investigations of the year don’t have to be the most complicated—they simply need to give students opportunities to explore, ask questions, and get familiar with tools.
Starting with predictions encourages students to commit to their ideas before collecting evidence. Simple sensor investigations then help them compare those predictions with real-world data, analyze patterns, and ask better questions. Those are skills they’ll use in every investigation that follows.
Looking for even more classroom-ready ideas? Watch our Simple Sensor Experiments to Start the School Year webinar to see demonstrations of these activities and more, hear teaching tips from former classroom educators, and access downloadable experiment files to use with your own students.
What’s your favorite sensor activity to start the new school year with? Share with us on social! Questions about Vernier technology? Reach out to our team at support@vernier.com, call (888)‑837‑6437, or drop us a line in the live chat.
Share this Article
Related Articles



Sign up for our newsletter
Stay in the loop! Beyond Measure delivers monthly updates on the latest news, ideas, and STEM resources from Vernier.