
Sharing ideas and inspiration for engagement, inclusion, and excellence in STEM
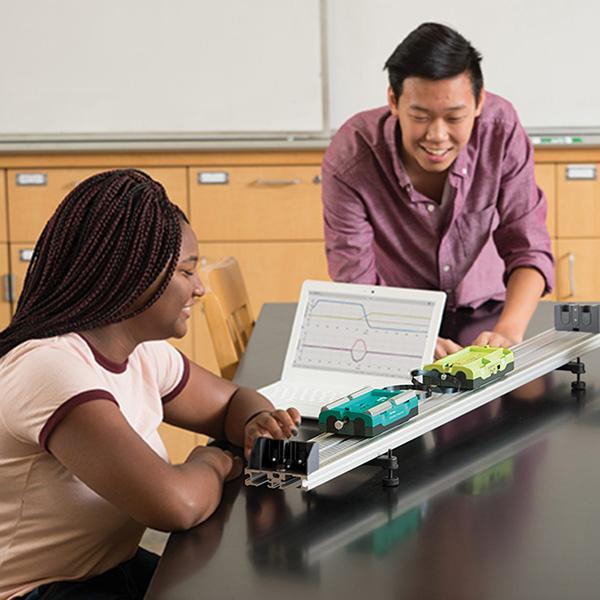
Whether it’s a skateboard accelerating down a hill, a shopping cart rolling to a stop, or two bumper cars colliding, motion is constantly changing in response to forces. Students can observe these events every day, but collecting and analyzing real‑time data helps them move beyond observation to explain the physics of what’s happening—and why.
The Dynamics Cart and Track System with Go Direct® Sensor Carts is a cornerstone of hands-on physics instruction, providing a complete foundation for exploring motion, forces, momentum, and energy. Combining Go Direct Sensor Carts with the included track and essential accessories, this system equips educators to teach a wide range of introductory and advanced investigations. The cart’s built-in sensors allow high school- and college-level students to collect force, position, velocity, and acceleration data directly on their Bluetooth® wireless technology enabled products, while simplifying setup and making it easy to conduct experiments both on and off the track.
Here are three easy‑to‑implement investigations to get started using the Dynamics Cart and Track System with Go Direct Sensor Carts in your physics classroom.
Newton’s Second Law
Experiment #4 from Advanced Physics with Vernier — Mechanics
Level: High School and College
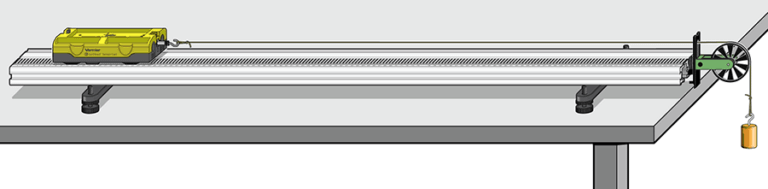
Using the Dynamics Cart and Track System with Go Direct Sensor Carts, students build a modified Atwood’s machine to investigate how varying the net force applied to a cart affects its acceleration. As the cart moves along the track, students collect force and velocity data, determine acceleration from the slope of a velocity vs. time graph, and compare multiple trials using different hanging masses. By graphing force vs. acceleration, they discover the linear relationship described by Newton’s second law and see how the slope of the graph relates to the mass of the system.
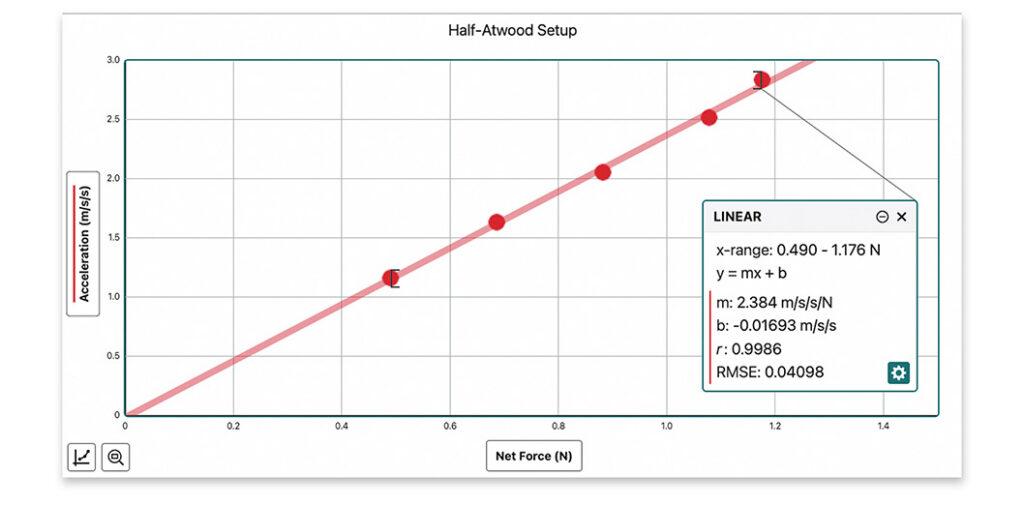
This investigation is an excellent introduction to experimental mechanics because it helps students develop the relationship F = ma through evidence rather than memorization.
Objectives
- Identify the forces acting on an object at rest and while accelerating.
- Collect force, velocity, and time data as a cart is accelerated on a track.
- Determine acceleration from a velocity vs. time graph.
- Investigate the relationship between net force, mass, and acceleration.
- Analyze and interpret data.
New Accessory Spotlight: DTS End Stop
Place the newly redesigned DTS End Stop between the pulley and cart to prevent the cart from crashing into the pulley during experimentation. The removable center tab allows the string to pass through the end stop unobstructed. See it in action here.
Momentum, Energy, and Collisions
Experiment #18 from Physics with Vernier
Level: High School and College
From a fender bender in a parking lot to a game of billiards, collisions can look very different—but they’re all governed by the same fundamental physics. This investigation gives students the opportunity to explore how momentum and kinetic energy change in different types of collisions.
Using the two Go Direct Sensor Carts included in the Dynamics Cart and Track System with Go Direct Sensor Carts, students investigate three different types of collisions by changing the carts’ collision tabs. They collect velocity data before and after each collision, calculate the total momentum and kinetic energy of the system, and compare how each quantity changes in elastic, inelastic, and completely inelastic collisions. As students analyze their results, they discover that while kinetic energy may change depending on the type of collision, total momentum remains approximately constant.
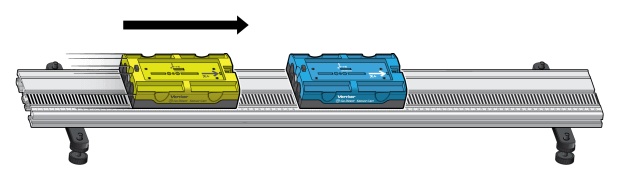
In this investigation, students use two Go Direct Sensor Carts to compare three types of collisions. By changing the carts’ collision tabs, they create completely inelastic collisions in which the carts stick together, inelastic collisions in which they separate smoothly without bouncing, and nearly elastic collisions using repelling magnetic collision tabs. Students collect velocity data before and after each collision, then calculate the total momentum and kinetic energy of the two‑cart system.
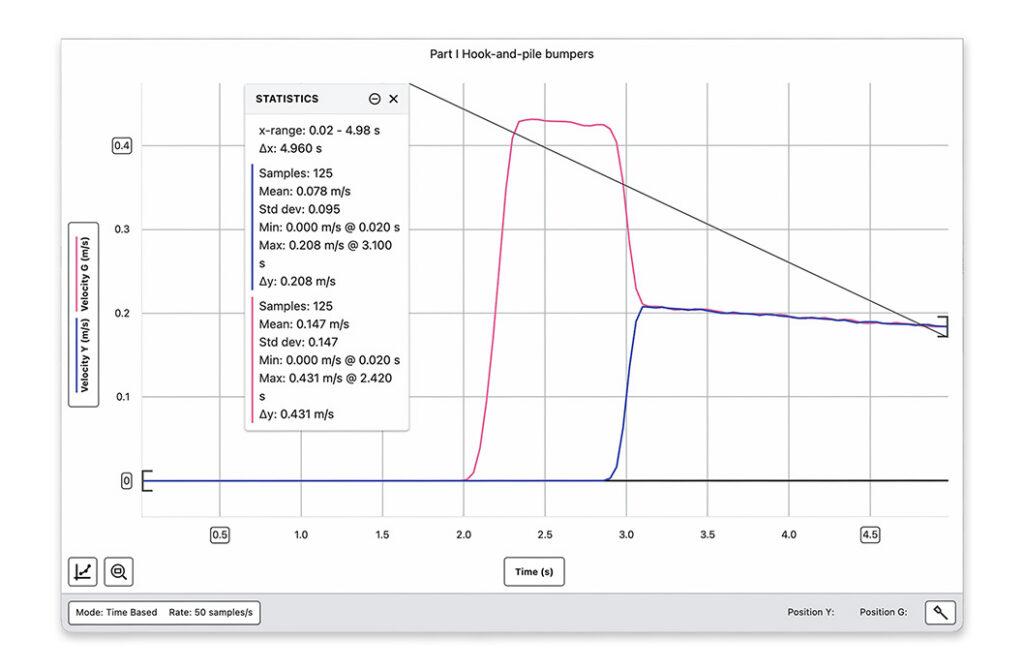
This investigation helps students distinguish between momentum conservation and energy conservation while recognizing that real‑world collisions can behave very differently depending on how the objects interact.
Objectives
- Observe collisions between two carts and test for the conservation of momentum.
- Measure changes in kinetic energy during different types of collisions.
- Compare momentum and kinetic energy before and after each collision.
- Classify collisions as elastic, inelastic, or completely inelastic.
- Analyze and interpret data.
New Accessory Spotlight: DTS End Stop
Use the interchangeable collision tabs, included with the redesigned DTS End Stop, to investigate elastic and inelastic collisions with barriers, a precursor to the impulse and momentum experiment.
Impulse and Momentum
Experiment #19 from Physics with Vernier
Level: High School and College
Why do airbags, seat belts, and padded surfaces help reduce injuries during a collision? While they don’t change the amount of momentum that must be transferred, they increase the amount of time over which the collision occurs, reducing the average force experienced. This investigation helps students connect that real‑world phenomenon to the impulse‑momentum theorem through hands‑on data collection.
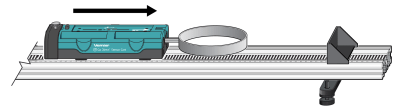
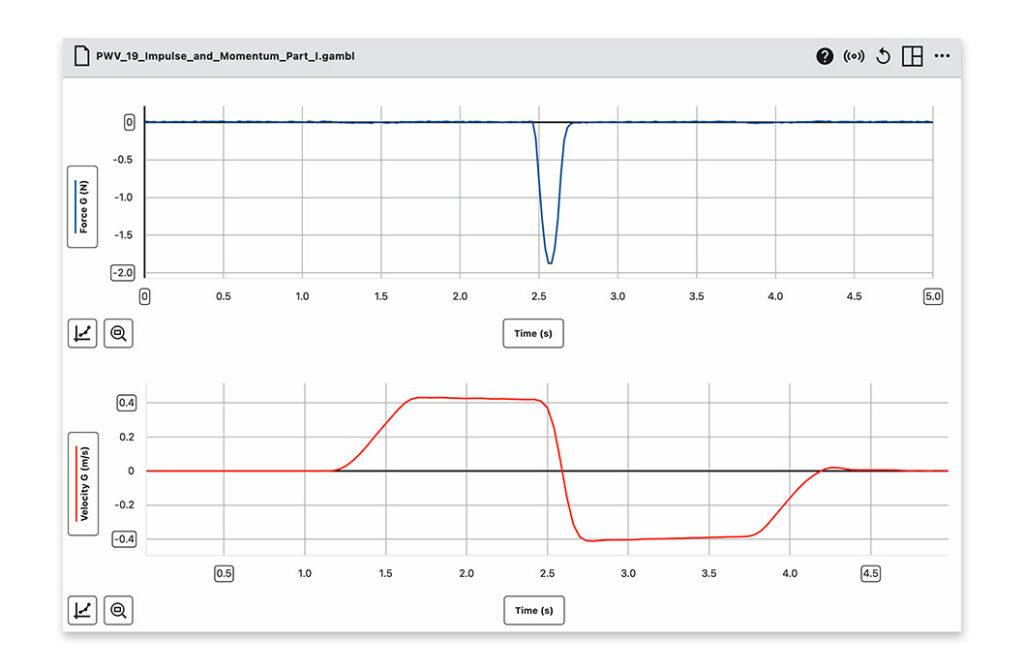
Using the Dynamics Cart and Track System with Go Direct Sensor Carts, students investigate the impulse‑momentum theorem by measuring both the force applied during a collision and the cart’s velocity before and after impact. They analyze force vs. time and velocity vs. time graphs to compare the calculated impulse with the cart’s measured change in momentum for both elastic and inelastic collisions. By comparing average and peak forces, students also explore how increasing the duration of a collision reduces the force experienced without changing the overall impulse.
Objectives
- Measure a cart’s change in momentum and compare it to the impulse it receives.
- Collect and analyze force vs.time and velocity vs. time data.
- Compare average and peak forces during collisions.
- Explain how increasing collision time reduces the force experienced during impact.
- Analyze and interpret data.
New Accessory Spotlight: DTS End Stop
Use the mounting holes on the center tab to attach bumpers directly to the new DTS End Stop, allowing students to extend the investigation to include barrier designs that might further reduce the maximum force during impact.
Looking for More Inspiration?
In this video, Vernier Director of Physics Fran Poodry discusses the various features and functionalities of the Go Direct Sensor Cart and walks through some easy-to-implement investigations to help students explore force, position, velocity, and acceleration.
Want to take your investigations even further? Add Cart Fans to investigate thrust, force, mass, and acceleration with hands-on activities. For even more ideas, check out Force and Motion: Creating Two Classic Physics Questions in Real Life with Vernier Cart Fans by Rhett Allain, along with our videos on Investigating Thrust, Mass, and Acceleration with the Cart Fan and Investigating Opposing Forces with the Vernier Cart Fan.
Plus, explore the redesigned DTS End Stop and discover a few additional ways to use it in your dynamics investigations.
How are you using the Dynamics Cart and Track System with Go Direct Sensor Carts in your STEM classroom? Let us know what you’ve done by sharing with us on social! Questions? Reach out to physics@vernier.com, call 888‑837‑6437, or drop us a line in the live chat.
Share this Article
Related Articles






Sign up for our newsletter
Stay in the loop! Beyond Measure delivers monthly updates on the latest news, ideas, and STEM resources from Vernier.