
Sharing ideas and inspiration for engagement, inclusion, and excellence in STEM
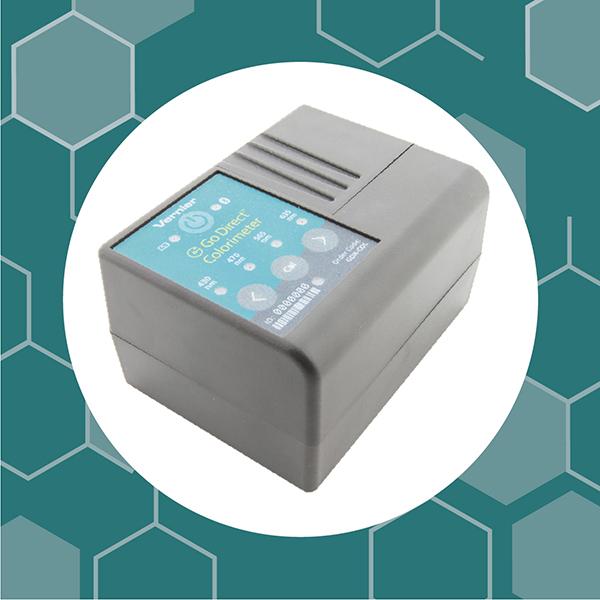
Answering questions like “How concentrated is this sample?” or “How fast is this reaction changing color?” involves more than simply observing a substance’s appearance. It requires students to measure and analyze the absorbance and transmittance of a liquid, just as scientists do in real‑world investigations.
The 4‑wavelength Go Direct® Colorimeter helps students easily collect this data and move beyond noting that “a solution looks darker” to quantifying what that actually means.
Using this wireless sensor, students can explore absorbance and percent transmittance in a variety of experiments, including Beer’s law (absorbance vs. concentration) and kinetic studies (concentration vs. time). The sensor features one‑step calibration and allows students to select among four wavelengths (430 nm, 470 nm, 565 nm, 635 nm) as they set up their experiment and begin data collection during a variety of biology, chemistry, and environmental science investigations.
Below are three easy‑to‑implement investigations to help high school and college‑level students get started with the Go Direct Colorimeter.
Beer’s Law Investigations
Experiment #11 from Investigating Chemistry through Inquiry
Levels: High School and College
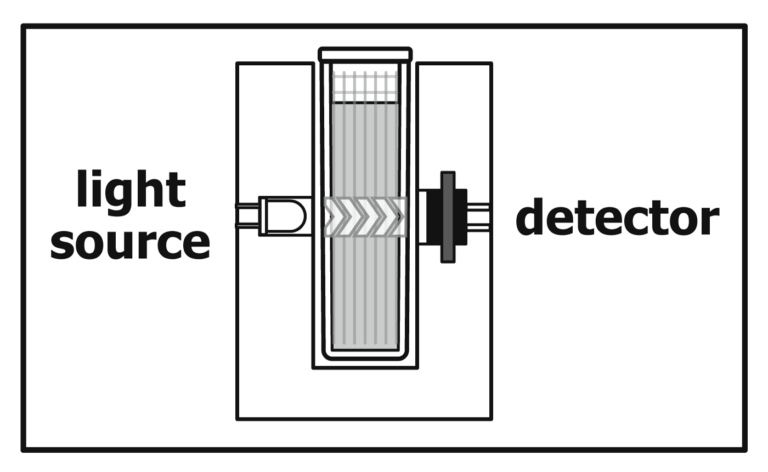
From testing drinking water for metal contamination to analyzing samples in medical labs, scientists often need to determine how much of a substance is dissolved in a liquid. When conducting this investigation, students apply the same technique to find the concentration of an unknown copper (II) sulfate solution.
During this investigation, students prepare five copper (II) sulfate solutions of known concentration. They then transfer each solution to a small, rectangular cuvette and place it in the Go Direct Colorimeter to measure the absorbance of each solution. Students use the Vernier Graphical Analysis® app to plot absorbance vs. concentration for the standard solutions and analyze the direct relationship between the two, as described by Beer’s law.
After completing this preliminary investigation, you can extend this activity by having students use reference sources to find out more about solutions and solution concentration, then choose and investigate a researchable question of their own using Beer’s law.
Objectives
- Plan and carry out an experiment.
- Determine the concentration of an unknown copper (II) sulfate solution.
- Use reference sources to choose and investigate a researchable question using Beer’s law.
- Analyze and interpret data.
Color Countdown Timer (Colorimeter)
Experiment #7B from Forensic Chemistry Experiments
Levels: High School and College
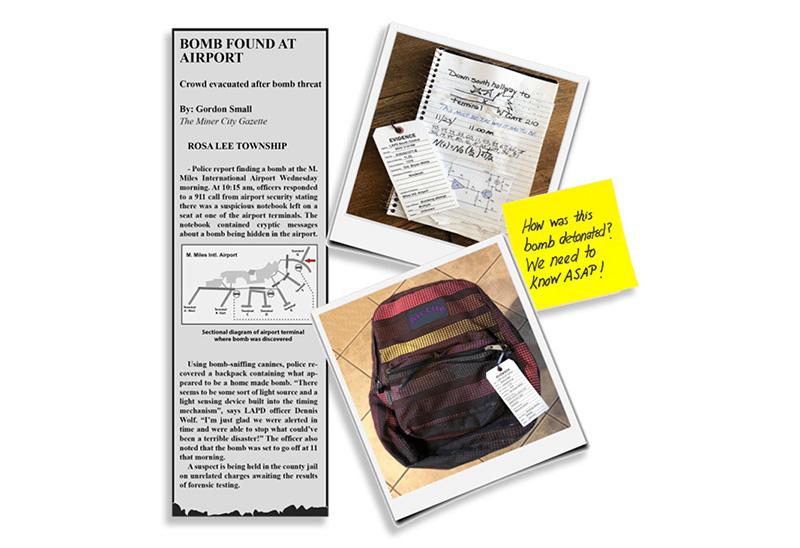
Have your students act as real‑world forensic scientists as they investigate how food dye and bleach solution recovered from a backpack acted as a bomb countdown timer in a high‑profile incident at a local airport.
To help crack the case, students use the Go Direct Colorimeter to measure the absorbance of a food dye solution at different wavelengths and identify the wavelength of maximum absorbance. Then, in part II of the investigation, they use the previously determined wavelength to collect data while observing the reaction between the food dye and bleach.
After analyzing their findings and drawing conclusions about how the bomb detonated, students—still acting as forensic scientists—write a report to help detectives present the case in court.
Objectives
- Plan and carry out an experiment.
- Apply scientific principles and evidence to provide an explanation about the effect of blue food dye concentration on the rate of reaction between bleach and food dye.
- Analyze and interpret absorbance spectra to identify the wavelengths of maximum absorbance for blue food dye.
- Use mathematical representations to determine the rate constant for the reaction between blue food dye and bleach and the half‑life of the reaction.
- Communicate technical information about the process used to identify the rate of change of blue food dye concentration using absorbance data.
- Analyze and interpret data.
Rate Law Determination of the Crystal Violet Reaction
Experiment #30 from Chemistry with Vernier
Level: High School
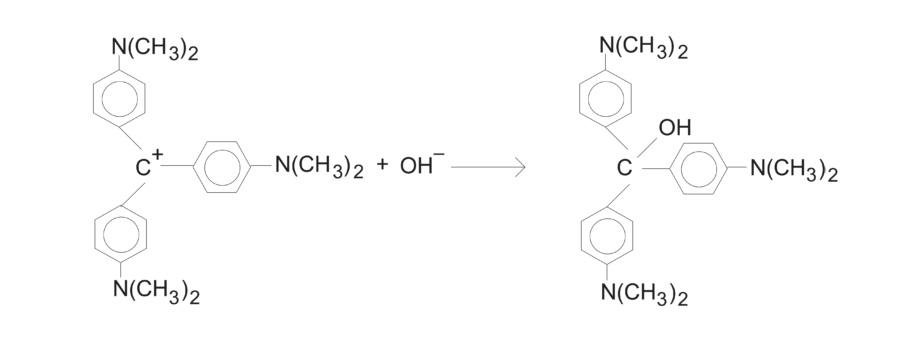
In this investigation, students measure how fast a chemical reaction happens and how the amount of a substance affects that speed by tracking a color change over time—just as scientists do when they are designing medicines or predicting how pollutants break down in the environment.
To start, students observe the reaction between crystal violet and sodium hydroxide, as well as study the relationship between the crystal violet concentration and the time elapsed during the reaction.
As the reaction proceeds, students use the Go Direct Colorimeter to measure the change in absorbance as the violet‑colored reactant gradually becomes a colorless product. They then use the data to create multiple graphs and draw conclusions about the crystal violet reaction.
Objectives
- Plan and carry out an experiment.
- Observe the reaction between crystal violet and sodium hydroxide.
- Monitor the absorbance of the crystal violet solution with time.
- Graph absorbance vs. time, ln absorbance vs. time, and 1/absorbance vs. time.
- Determine the order of the reaction.
- Determine the rate constant, k, and the half‑life for this reaction.
- Analyze and interpret data.
Looking for more inspiration?
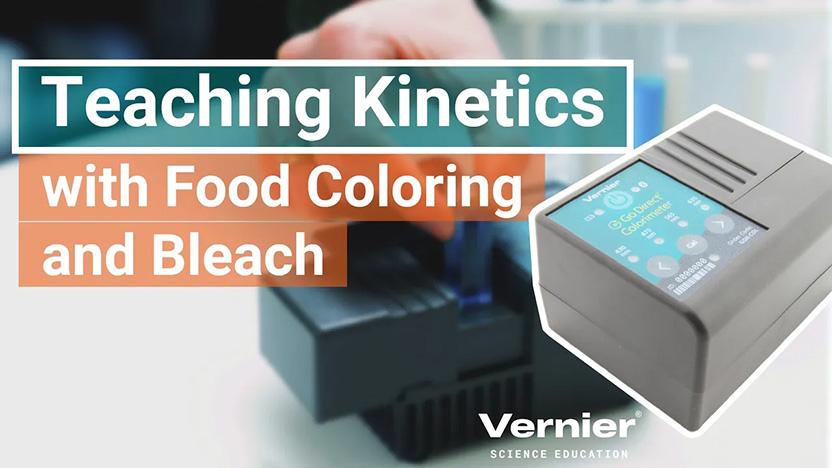
Watch our free, on-demand webinar, led by Vernier chemistry expert Nüs Hisim, outlining additional experiments that use data‑collection technology, including using the Go Direct Colorimeter to help students observe the reaction between blue food coloring and bleach.
How are you using the Go Direct Colorimeter in your STEM classroom? Let us know what you’ve done by sharing with us on social! Questions? Reach out to support@vernier.com, call 888‑837‑6437, or drop us a line in the live chat.
Share this Article
Related Articles





Sign up for our newsletter
Stay in the loop! Beyond Measure delivers monthly updates on the latest news, ideas, and STEM resources from Vernier.