Sharing ideas and inspiration for engagement, inclusion, and excellence in STEM
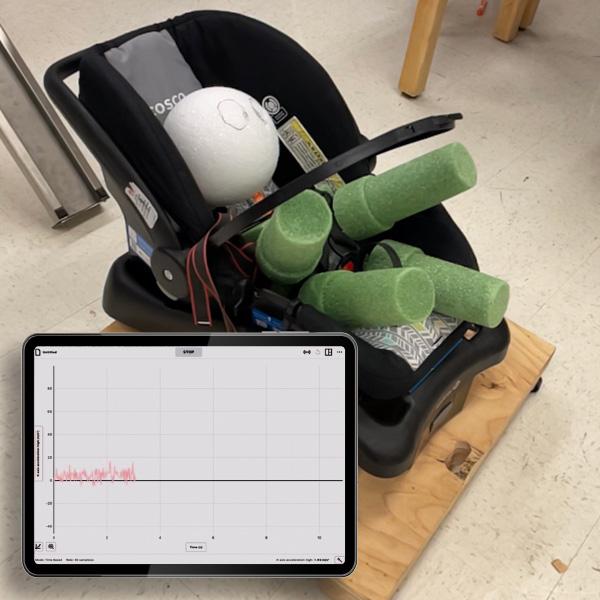
“What’s going on here?” our principal asks, eyebrows raised, as a foam baby in a car seat attached to a dolly races down a ramp, straight into a brick wall.
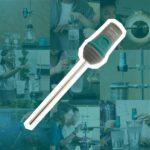
“Oh you know, Mr. Watkins shoved an acceleration sensor in the baby’s head. Physics stuff.”
With only one acceleration sensor in a class of 30 students, you sometimes have to get a little creative in your lesson planning. But if your budget is limited, there’s still a huge benefit from incorporating even just a few different data-collection sensors into your teaching. In this blog post, I’m sharing three investigations I created to engage my class using sensors from the Physics Go Direct® Standard Package.
Supporting Three-Dimensional Physics Learning with Vernier Sensors
When I first started teaching with the Next Generation Science Standards (NGSS), I reorganized the curriculum to reflect three-dimensional learning and structured each unit around a phenomena-based challenge. In my Forces and Momentum unit, for example, students investigated whether a forward-facing or rear-facing car seat is safer for children (see detailed activity below). While lessons on Newton’s laws and momentum labs provide the conceptual foundation, collecting real-time, quantitative data can connect these concepts to real-world scenarios. This is where Vernier Go Direct sensors truly shine.
In 2021, my school was fortunate enough to receive a modest grant for our science department. After addressing essential equipment needs, we had leftover funds I had earmarked for new Vernier Go Direct probes. We discussed purchasing a classroom set of probes, but I advocated for choosing the Physics Go Direct Standard Package, which includes a variety of sensors applicable across all physics and physical science courses.
Since most labs typically require multiple sensors for independent group data collection, working with just one sensor required a paradigm shift of sorts. But by thinking outside the box, you can utilize one sensor in your class in original ways. Here are a few examples of how my class tested phenomena using these sensors.
Three Phenomena-Based Physics Investigations Using Single Sensors
1. Investigating Car Seat Safety
Car Seat Safety Investigation Handout
Course: Physical Science (10th Grade)
Unit: Forces and Momentum
Phenomena: As car seat technology has improved greatly over the last half-century, one of the biggest determiners of child car crash fatalities is whether or not a child’s car seat is correctly installed. In this unit, students will use Newton’s laws and the conservation of momentum law to develop a data-informed claim for whether it is safer to have an infant’s car seat forward facing or rear facing in a car.
| 3D Elements in this Investigation | |
| Disciplinary Core Ideas | HS-PS2-1 Newton’s Second Law of Motion HS-PS2-2 Conservation of Momentum HS-PS2-3 Reducing Force in Collisions |
| Science and Engineering Practices | Asking Questions & Defining Problems Developing & Using Models Planning & Carrying Out Investigations Analyzing & Interpreting Data Math & Computation Engaging in Argument from Evidence |
| Crosscutting Concepts | Patterns Systems & System Models |
For this investigation, my class collected data by inserting a Vernier Go Direct Accelerometer into a DIY “baby” model to test in a car seat. Here’s how we created the model.
Building the Model
- Use a foam ball for the head, a foam cube for the body, and floral foam inserts for the limbs, connected by wooden skewers or dowels.
- Cut 4-inch deep holes in the body and head foam, then insert a zinc-plated extension spring, leaving 3-4 inches exposed as the “neck.”
- Secure the model in an old car seat (I found mine on the side of the road), and mount it to a plywood base with casters. I used ratchet straps to secure it.
- Insert the accelerometer into the back of the model’s head. Make sure it will be level and parallel to the ground when inserted.

Testing the Model
Each group tests the model in four different “car crash” variations:
- Rear-end collision with the car seat forward facing
- Rear-end collision with the car seat rear facing
- Front-end collision with the car seat forward facing
- Front-end collision with the car seat rear facing
To model a rear-end collision, we set a ramp on a table, placed the car seat model at the base, and rolled a bowling ball down while collecting the accelerometer data. We did this twice (or multiple trials if time allows) with the model facing both forward and rear.
To model a front-end collision, we placed the model at the top of a ramp with a concrete wall near the base and rolled it down to crash into the wall. Alternatively, you can attach a ratchet strap to the model and let it roll down a ramp until tension in the strap stops it.
“Physics stuff.”
Using this model as a culminating lesson on forces and momentum gives students a real-world application for Newton’s laws and concepts of momentum and impulse. Students analyze the qualitative and quantitative data in Vernier Graphical Analysis® to make their data-informed claim.
2. Forensics Analysis: Hyatt Regency Bridge Collapse
Forensics Analysis: Hyatt Regency Bridge Collapse Handout
Course: Physics (11th & 12th Grade)
Unit: Forces
Phenomenon: On July 17, 1981, the Hyatt Regency in Kansas City, MO, designed a unique floating walkway with two levels. Shortly after the grand opening, it collapsed killing over 100 people and injuring many more. In the forensic analysis, it appeared that the load-bearing design was changed between the engineer and manufacturer. In this 3D assessment, students design and build two models of the floating bridges to compare the original and altered designs. They use a Vernier Go Direct Force and Acceleration Sensor to measure which design supports a greater load.
| 3D Elements in this Investigation | |
| Disciplinary Core Ideas | HS-PS2-1 Newton’s Second Law |
| Science and Engineering Practices | Asking Questions & Defining Problems Developing & Using Models Planning & Carrying Out Investigations Analyzing & Interpreting Data Engaging in Argument from Evidence |
| Crosscutting Concepts | Systems & System Models |


Materials for Building Bridge Models (Per Set)
- 2 lb or 4 lb fishing line
- Small washers
- One 2 ft x 1 in x 1 in board
- Two 2 ft x 2 in x ¼ in boards
- Vernier Go Direct Force Sensor
Testing the Model
- If time allows, students can build and test both designs; alternatively, they can partner with another group and build one design each.
- Once the model is set up, hang it from a Vernier Go Direct Force and Acceleration Sensor by either holding it or attaching it to a ring stand or other mounted bar.
- Use various weights distributed on the two “walkways” or use both hands to progressively press down on both “walkways” with increasing force.
- Use Vernier Graphical Analysis to measure the increasing force and identify the maximum force before breaking.

3. Mapping the Ocean Floor
Mapping the Ocean Floor Handout
This lesson was adapted from “Topography-A LIDAR Simulation” by Don Higdon at UMBC – Goddard Earth Science and Technology Center
Course: Physical Science (10th Grade)
Unit: Earth’s Interior & Plate Tectonics
Phenomenon: I often struggle to incorporate data-collection labs into plate tectonic topics, but I discovered a way to combine a history lesson, highlight an important woman in science, and simulate how scientists collect data from the seafloor! This lesson focuses on the contributions of Marie Tharp, how scientists map the seafloor, and magnetic striping. It utilizes the Vernier Go Direct Motion Detector and the Go Direct 3-Axis Magnetic Field Sensor.
| 3D Elements in this Investigation | |
| Disciplinary Core Ideas | HS-ESS1-5 Evidence of Plate Tectonics HS-ESS2-1 The Creation of Landforms |
| Science and Engineering Practices | Analyzing & Interpreting Data |
| Crosscutting Concepts | Scale, Proportion, Quantity Stability & Change |

map the “terrain.”
Building and Mapping the Model
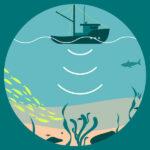
To simulate the process of mapping the seafloor, I set up a PVC pipe over a flat area using a stand to hold it in place. I attached a wider PVC cutoff piece to which the motion detector was attached to, pointing downwards. With a string tied to the sensor attachment, students could pull the suspended motion detector across the floor. Using boxes of various sizes, students would collect data mapping the topography of the “seafloor” using ultrasonic waves, just like scientists do in the real world! Using their Graphical Analysis data, students create a topographical map.
Separately, I took 24 bar magnets and arranged them in a line spaced one-half inches apart, alternating their poles. I placed a large piece of paper over the magnets so they were not visible. Students then use the 3-Axis Magnetic Field Sensor and slowly drag it above the paper while recording data. The resulting graph shows an alternating pattern, which students then discuss to try to determine its cause. We then connect to the ways the data matches the patterns found on our own seafloor.

One Sensor, Many Possibilities
In a perfect world where schools are fully funded, every science classroom would include class sets of multiple types of Vernier sensors. However, that is not the reality for schools like mine. To help students collect real data and explore applying their scientific thinking in real-world applications, it is crucial to provide them with the data-collection tools to make that happen.
This is an encouragement to not get stuck thinking that the choice is between 50 sensors or none. A lot can be accomplished with just a single sensor—it just takes some ingenuity, a little DIY, and the knowledge that you are opening the door to more STEM opportunities.

Nick teaches physics, Earth science, and physical science at Franklin Pierce High School in Tacoma, WA, and is a member of the Vernier Trendsetters Community. With over a decade of experience in K–12 science education, Nick is passionate about inspiring students to investigate the physical world through hands-on investigations. Outside of the classroom, you can find him @PNWPhysics
Share this Article

Sign up for our newsletter
Stay in the loop! Beyond Measure delivers monthly updates on the latest news, ideas, and STEM resources from Vernier.

