Go Direct® Visible Spectrophotometer User Manual
Order Code: GDX-SPEC-VIS
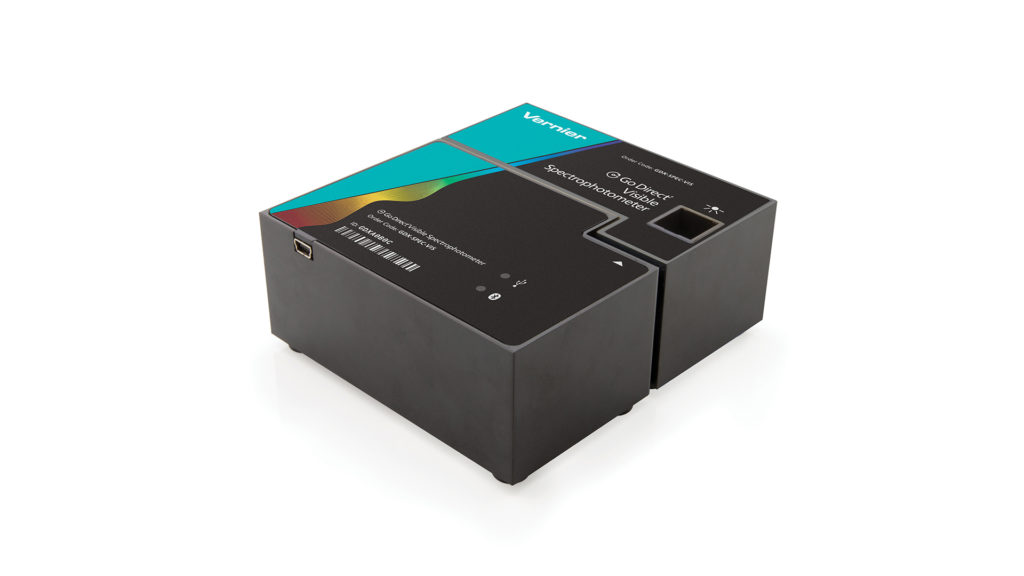
The Go Direct Visible Spectrophotometer is a robust and accurate portable visible light spectrophotometer that connects easily to your device via Bluetooth® wireless technology or USB to conduct Beer’s law experiments, kinetic or equilibrium studies of absorbance, or emission spectrum analysis.
Note: Vernier products are designed for educational use. Our products are not designed nor are they recommended for any industrial, medical, or commercial process such as life support, patient diagnosis, control of a manufacturing process, or industrial testing of any kind.
What's Included
- Go Direct Visible Spectrophotometer
- Plastic cuvettes and lids (15)
- Mini USB cable
- USB Power Adapter
Compatible Software and Interfaces
Choose a platform below to see its compatibility requirements.LabQuest
Interface LabQuest App LabQuest 3 Full support 1 LabQuest 2 Full support 1 LabQuest Incompatible Compatibility Notes
Computers
Software Interface Spectral Analysis Graphical Analysis No interface required Full support Incompatible LabQuest 3 Incompatible Full support 1 LabQuest 2 Incompatible Full support 1 Compatibility Notes
Chromebook
Software Interface Spectral Analysis (Web App) No interface required Full support iOS
Software Interface Spectral Analysis Graphical Analysis Graphical Analysis GW No interface required Full support Incompatible Incompatible LabQuest 3 Incompatible Full support 1 2 Full support 1 2 LabQuest 2 Incompatible Full support 1 2 Full support 1 2 Compatibility Notes
Android
Software Interface Spectral Analysis Graphical Analysis Graphical Analysis GW No interface required Full support Incompatible Incompatible LabQuest 3 Incompatible Full support 1 2 Full support 1 2 LabQuest 2 Incompatible Full support 1 2 Full support 1 2 Compatibility Notes
Quick Start: Vernier Spectral Analysis and Bluetooth
- To power the Bluetooth radio, connect the spectrometer to the USB Power Adapter or to a powered USB hub. The Bluetooth LED will blink. Note: Do not plug the USB into a computer USB port to run with Bluetooth wireless technology.
- Launch Vernier Spectral Analysis®, then click Connect a Spectrometer.
- Select your Go Direct Visible Spectrophotometer from the list of discovered wireless devices. The sensor ID is located on the sensor label near the bar code.
- Click DONE. You are now ready to collect data.
Using other Vernier data-collection apps or connecting via USB?
Visit www.vernier.com/start-spectrometer
Note: This sensor also works with LabQuest 2 and LabQuest 3; it does not work with the original LabQuest.
Connecting the Sensor
See the following link for up-to-date connection information:
www.vernier.com/start/gdx-spec-vis
Connecting via Bluetooth
| Ready to connect | Connect the USB to the USB power adapter or to a powered USB hub. Blue LED next to Bluetooth icon flashes when sensor is ready to connect. |
| Connected | Blue LED next to Bluetooth icon is solid when sensor is connected via Bluetooth wireless technology. |
Connecting via USB
| Connected | LED next to Bluetooth icon is off. LED next to USB icon is solid green. |
Using the Product with Spectral Analysis
Connect the sensor following the steps in the Quick Start section of this user manual.
Select the Type of Data to Measure
The three options for Experiment Types are
- Measurement vs. Wavelength—collect a full spectrum.
- Measurement vs. Concentration—conduct a Beer's law experiment.
- Measurement vs. Time—collect time-based data for a kinetics experiment.
By default, Absorbance is expanded. You can also choose from % Transmittance, Emissions, or Advanced Full Spectrum. Use the Advanced Full Spectrum mode to switch among all the measurement types in the same session. For complete instructions, refer to the Spectral Analysis user manual at www.vernier.com/sa
Measurement vs. Wavelength (Full Spectrum)
- Select Measurement vs. Wavelength.
- If applicable, follow instructions for calibration. Align the cuvette so the clear side of the cuvette is facing the light source. Note: Calibration is not required for intensity.
- You are now ready to collect data. Fill a cuvette about 3/4 full of a sample of the solution to be tested. Place the sample in the Spectrophotometer and click or tap Collect. Click or tap Stop to end data collection. The spectrum is automatically stored.
- Save or export your data from the File menu.
Measurement vs. Concentration (Beer's law)
- Select Measurement vs. Concentration.
- If applicable, follow instructions for calibration. Align the cuvette so the clear side of the cuvette is facing the light source. Note: Calibration is not required for intensity.
- Follow the instructions in the Choose a Wavelength dialog box. Select Done.
- Click or tap Collect. Your first sample should still be in the Spectrophotometer. After the reading stabilizes, click or tap Keep. Enter the concentration of the sample and click or tap Keep Point.
- Place your second sample in the cuvette slot. After the reading stabilizes, click or tap Keep. Enter the concentration of the sample and click or tap Keep Point.
- Repeat the previous step for the remaining samples. When finished, click or tap Stop to end data collection. The data are automatically stored.
- To see the best fit line equation for the standard solutions, click or tap Graph Tools, select Apply Curve Fit, and choose Linear. Click or tap Apply.
- If doing Beer's law to determine the concentration of an unknown, place the unknown sample in the cuvette holder. Click or tap Graph Tools and enable Interpolate. Click or tap along the line until you find the concentration value that matches your unknown's measurement.
- Save or export your data from the File menu.
Measurement vs. Time (Kinetics)
- Select Measurement vs. Time.
- If applicable, follow instructions for calibration. Align the cuvette so the clear side of the cuvette is facing the light source. Note: Calibration is not required for intensity.
- Follow the instructions in the Choose a Wavelength dialog box. Select Done.
- The default data-collection settings collect measurements every two seconds until the user manually stops data collection.
- Mix the reactants. Transfer ~2 mL of the reaction mixture to a cuvette and place the cuvette in the spectrometer. Click or tap Collect.
- When finished, click or tap Stop.
- To fit a function to the data, click or tap Graph Tools, select Apply Curve Fit, and choose the appropriate curve fit. Click or tap Apply.
- To add a calculated column to the data set, click or tap OK in the measurement header on the data table. Select Add Calculated Column. Modify the name, units, and displayed precision accordingly. Select Insert Expression and select the appropriate equation. Modify the parameters and column options, if necessary. Click or tap Apply. The calculated column is automatically displayed on the graph.
- Save or export your data from the File menu.
Change the Settings in Spectral Analysis
- Click or tap the gear to show the Spectrometer Settings dialog.
- There are three parameters listed in the dialog box:
- Integration Time: This is similar to the shutter speed of a camera. Spectral Analysis automatically selects the proper sample time during calibration in Absorbance and % Transmittance modes. If using Intensity or Advanced Experiment modes, you can modify this value to increase the amount of light hitting the detector and the signal spectral output.
- Wavelength Smoothing: This is the number of adjacent readings on either side of a given value that is used to calculate an average value.
- Temporal Averaging: This is the number of readings taken at a given wavelength to calculate an average reading.
- Select the Calibrate button to recalibrate your spectrometer at any time.
Measure an Emission Spectrum with Spectral Analysis
You may use your spectrophotometer to measure the emission spectrum of a light source such as an LED or a gas discharge tube. To do so, you will need to purchase the Vernier Optical Fiber (order code: VSP-EM-FIBER).
Measure Intensity of Light Emissions
To measure emissions with the spectrometer, detach the lamp/cuvette side of the spectrometer by pulling the two pieces apart. They are magnetically attached, so it shouldn’t require much force. Screw the fiber optic cable onto the detector side.
- Connect the sensor following the steps in the Quick Start section of this user manual.
- Launch Spectral Analysis.
- Select the appropriate Emissions experiment from the listed options and follow the prompts in the app. Intensity is a relative measure with a range of 0–1. Note: The Spectrophotometer is not calibrated for measuring intensity.
- Aim the tip of the optical fiber at a light source. Start data collection. Click or tap the Stop button to end data collection.
If the spectrum maxes out (flat and wide peaks at a value of 1), increase the distance between the light source and the tip of the optical fiber cable or reduce the integration time (see the Change the Settings in Spectral Analysis section).
To adjust the integration time, click or tap the gear. Set the integration time to a suitable value.
Using the Spectrophotometer with LabQuest 2 or LabQuest 3
Select the Type of Data (or Units) You Want to Measure
There are three general types of data collection that measure absorbance or transmittance—absorbance (or %T) vs. wavelength, which produces a spectrum, absorbance (or %T) vs. concentration for Beer’s law experiments, and absorbance (or %T) vs. time for kinetics experiments.
The default data type is absorbance. If you want to measure the absorbance of a solution, proceed directly to the Calibrate section.
If you want to measure %T or intensity, do the following:
- From the Sensors menu, choose Change Units ► USB: Spectrophotometer.
- Select the unit or data type you wish to measure.
Calibrate the Spectrophotometer (Not Required if Measuring Intensity)
- Choose Calibrate ► USB: Spectrophotometer from the Sensors menu. Note: For best results, allow the Spectrophotometer to warm up for a minimum of five minutes.
- Fill a cuvette about 3/4 full with distilled water (or the solvent being used in the experiment) to serve as the blank. After the Spectrophotometer has warmed up, place the blank cuvette in the Spectrophotometer. Align the cuvette so a clear side of the cuvette is facing the light source.
- Follow the instructions in the dialog box to complete the calibration, and then tap OK.
Collect Data with LabQuest
Measurement vs. Wavelength (Generate a Spectrum)
- Fill a cuvette about 3/4 full of the solution to be tested and place it in the Spectrophotometer.
- Start data collection by tapping on the Start button in the lower left corner of the screen. Tap the Stop button to end data collection.
- Select wavelength. You can tap on the graph to select a wavelength. Another way to change the wavelength is to navigate to the Meter screen, tap on the meter, and select Change Wavelength. Enter the wavelength of your choice and select OK. If the wavelength you type in is not measured by the unit, LabQuest will automatically choose the wavelength closest to your choice.
- To store the spectrum data, tap on the file cabinet icon in the upper right of your screen.
Measurement vs. Concentration (Beer’s Law Studies)
- Generate a spectrum as described above. On the Meter screen, tap Mode. Change the mode to Events with Entry.
- Enter the Name (e.g., Concentration) and Units (e.g., mol/L). Select OK.
- A message will appear warning you to either save or discard the full spectrum run. Make your choice and proceed with data collection.
- Place your first Beer’s law standard solution in the Spectrophotometer. Start data collection. After the absorbance reading stabilizes, tap Keep. Enter the concentration of the solution and select OK.
- Place your second standard sample in the Spectrophotometer. After the absorbance readings stabilize, tap Keep. Enter the concentration of the second sample and select OK.
- Repeat Step 5 for the remaining standard samples. After you have tested the final standard, tap the Stop button to end data collection.
- To calculate a best fit line equation for your standards, choose Curve Fit from the Analyze menu. Select Linear for the Fit Equation, and then select OK. The graph screen will appear again with the linear regression equation displayed.
- Place a cuvette containing an unknown sample of solution in the Spectrophotometer. Tap the Meter tab and write down the displayed absorbance value. Tap the Graph tab and choose Interpolate from the Analyze menu. Trace the linear regression equation to determine the concentration of the unknown.
Measurement vs. Time (Kinetics)
- Generate a spectrum as described above. On the Meter screen, tap Mode. Change the data-collection mode to Time Based.
- You can change the rate, interval, and/or duration of time of data collection, if desired. Select OK when you are ready to proceed.
- A message will appear warning you to either save or discard the full spectrum run. Make your choice and proceed with data collection.
- Mix the reactants, transfer ~2 mL of the reaction mixture to a cuvette and place the cuvette in the Spectrophotometer. Start data collection. You may tap the Stop button to end data collection early.
- To calculate a function for your data, choose Curve Fit from the Analyze menu. Select the Fit Equation, and then select OK. The graph screen will appear again.
Measure an Emission Spectrum with LabQuest
You may use your Spectrophotometer to measure the emission spectrum of a light source such as an LED or a gas discharge tube. To do so, you will need to purchase an optical fiber assembly (order code: VSP-EM-FIBER).
Measure Intensity of Light Emissions
- Connect the Spectrophotometer Optical Fiber to the Visible Spectrophotometer. Detach the lamp/cuvette side of the spectrometer by pulling the two pieces apart. They are magnetically attached, so it shouldn’t require much force.
- Aim the tip of the optical fiber at a light source. Start data collection. Tap the Stop button to end data collection. Note: The Spectrophotometer is not calibrated for measuring intensity.
If the spectrum maxes out (flat and wide peaks at a value of 1), increase the distance between the light source and the tip of the optical fiber cable or reduce the sample time (see Change the Settings in LabQuest below).
To increase the sample time, or if data collection is unusually slow, choose Set Up Sensors ► Spectrophotometer: 1 from the Experiment menu. Set the Sample Time (begin with 75 ms, with subsequent reductions by 20 ms) to a suitable value and decrease the Samples to Average to 1.
Change the Settings in LabQuest
The Data Collection Screen in LabQuest lists all the settings for the device. To display this box choose Sensors ► Data Collection from the Meter screen.
For most experiments, the default settings work well.
There are five parameters listed in the dialog box.
- Sample Time: This is similar to the shutter speed of a camera. LabQuest automatically selects the proper sample time during calibration. Note: For emission studies, you may need to change the sample time manually.
- Wavelength Smoothing: This is the number of adjacent readings on either side of a given value that is used to calculate an average value. Note: Be careful adjusting this parameter as it may shift your wavelength values slightly.
- Samples to Average: This is the number of readings taken at a given wavelength to calculate an average reading.
- Wavelength Range: The range is determined by the type of Spectrophotometer in use.
Specifications
|
Wavelength range |
380 nm–950 nm |
|
Reported wavelength interval |
~1 nm between reported values |
|
Optical resolution |
3.0 nm (as determined with 486 nm hydrogen emission spectral line FWHM) |
|
Wavelength accuracy |
± 2.0 nm (as determined with holmium oxide NIST standard) |
|
Absorbance photometric accuracy |
± 0.05 between 0.1 and 1.0 absorbance units (as determined with potassium dichromate NIST standards) |
|
Typical scan time |
~2 s |
|
Detection modes |
Absorbance, % Transmittance, Raw Lamp Output, and Intensity (fiber required) |
|
Absorbance light source |
Incandescent |
|
Detector |
Linear CCD |
|
Sample format |
10 mm × 10 mm cuvette |
|
Beam height (z dimension) |
8.5 mm |
Safety
- No user-serviceable parts are in this device. Do not attempt to open or modify this device. Contact Vernier for all repairs and service including lamp replacement.
- Handle the device with care. This instrument can be damaged if it is dropped.
- Do not use this instrument if it is damaged in any way. Contact Vernier Technical Support for troubleshooting and technical assistance.
- Do not use this instrument for clinical or diagnostic procedures.
Troubleshooting
For best results, the absorbance values for all samples must be between 0.1 and 1.0 absorbance units at all wavelengths.
Find troubleshooting tips here: www.vernier.com/til/13838
Repair Information
- Contact Vernier for all repairs and service including lamp replacement.
- No user-serviceable parts are in this device. Do not attempt to open the case of the device. Do not attempt to change or repair the lamp. Doing so will create an unsafe operating condition and will void the product warranty.
If you have watched the related product video(s), followed the troubleshooting steps, and are still having trouble with your Go Direct Visible Spectrophotometer, contact Vernier Technical Support at support@vernier.com or call 888-837-6437. Support specialists will work with you to determine if the unit needs to be sent in for repair. At that time, a Return Merchandise Authorization (RMA) number will be issued and instructions will be communicated on how to return the unit for repair.
Accessories/ Replacements
| Item | Order Code |
|---|---|
|
CUV-RACK |
|
|
CUV |
|
|
VSP-EM-FIBER |
|
|
CB-USB-MINI |
Warranty
Warranty information for this product can be found on the Support tab at www.vernier.com/gdx-spec-vis/#support
General warranty information can be found at www.vernier.com/warranty
Contact Support
Fill out our online support form or call us toll-free at 1-888-837-6437.