Experiment 8 – “Mapping Electric Potential” from Advanced Physics with Vernier—Beyond Mechanics was updated with the release of the 4th Edition of the book. You can access the most recent editions for any Vernier books your school owns from your Vernier web account.
The Mapping Electric Potentials activity from our lab manual Advanced Physics with Vernier — Beyond Mechanics (
The Problem
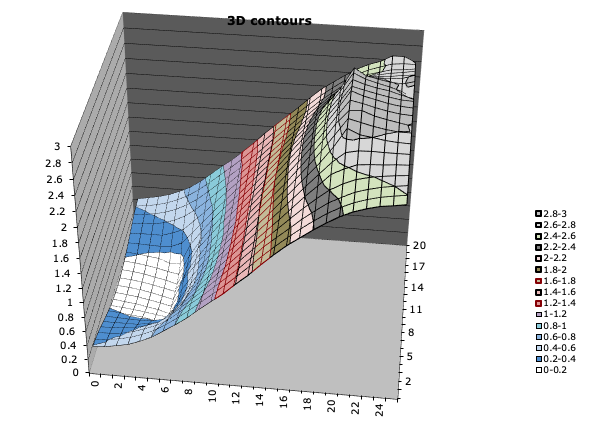
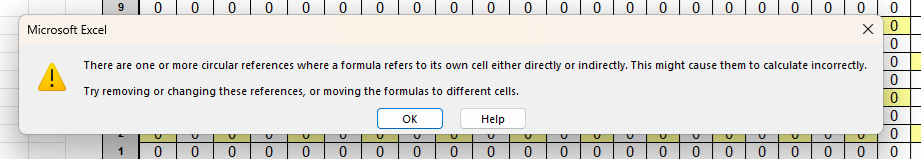
Some Excel settings can prevent the spreadsheet from interpolating electric potential correctly. A common error warns of “circular” references. Another error is having the #VALUE error in some or all of the interpolated cells.
Resolving the Issue
Here are some things to check when you see this.
- Check the “Enable iterative calculation” box found in the File >Options >Formulas menu. This feature gets you past the circular errors message, since it allows Excel to perform the calculation successive times until it reaches a solution. This feature was “on” by default in earlier versions of Excel but isn’t necessarily “on” in later versions.
- Be careful that the cells are populated only by numbers, formatted as such or as “general” cells. If you mistype even one cell – say, type 2,35 instead of 2.35, which causes the cell format to be set to “text” – the spreadsheet propagates the #VALUE error across the interpolated cells. (Note: it appears, the “undo” button won’t undo the cell format change).
If this has happened, open a new template file and copy/paste your data into it.
An Alternative to using Excel
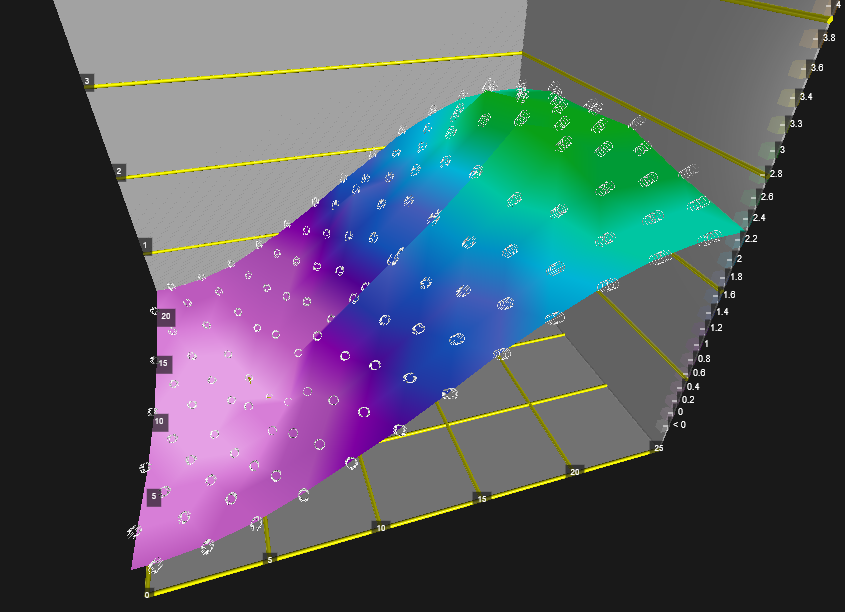
If you continue to have problems using the Excel spreadsheet, the 4th Edition includes a version of instructions that uses a VPython file* for generating the 2D and 3D plots.
* The VPython file runs in a browser and does not require any software or app installation.
Note: Data collected following the 1st Edition instructions can not be used as-is with the 4th Edition files. This is because the 4th Edition lab has students collect data from fewer points on the grid.