Brendon Walters, a 7th grade student at Patton Middle School, McMinnville, OR, recently spent the day at Vernier as part of “Take Your Daughters and Sons to Work Day.” We put him to work collecting data that he could graph and model using InspireData software from Inspiration Software.
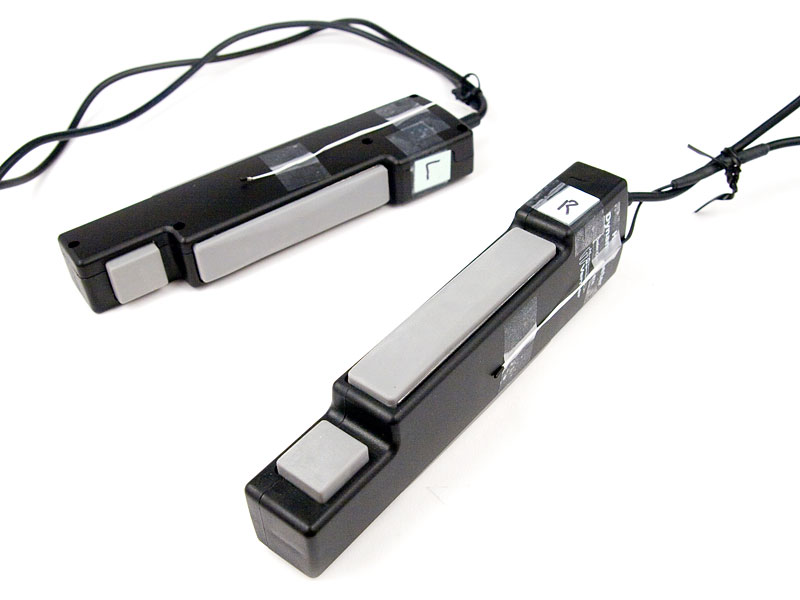
Brendon’s experiment combined sensor data and survey questions to investigate relationships among grip strength, hand temperature, gender, handedness, and perception of hand strength. To collect the data, he taped Surface Temperature Probes to the sides of two Hand Dynamometers so that the temperature probes would be covered by the test subject’s hand while measuring their grip force. The four sensors were connected to a LabQuest interface which was then connected to a computer. The data were collected using Logger Lite computer software in Events with Entry mode with the data averaged over 10 seconds. The “Entry” fields included gender, handedness, and perception of strongest hand for each participant.
Brendon tested 15 males and 15 females. Each participant was required to stand during the experiment. He collected the data while the test subject was squeezing with both hands as hard as he or she could.
Brendon then exported the data to InspireData and built some graphs to help investigate relationships between the variables. Using these graphs, we created an activity on understanding graphing.
Click on any of the graphs below to see a larger version.
Downloads for this activity: