John Melville, our Biology Staff Scientist, has developed an innovative way to demonstrate how the electrical and physical events of the cardiac cycle are related using a Blood Pressure Sensor (BPS-BTA $105) and an EKG Sensor (EKG-BTA $147) with our award-winning Logger Pro software.
EKG with Blood Pressure Pulse
Blood pressure is a measure of the changing fluid pressure within the circulatory system. It varies from a peak pressure produced by contraction of the left ventricle of the heart, to a low pressure, which is maintained by closure of the aortic valve and elastic recoil of the arterial system.
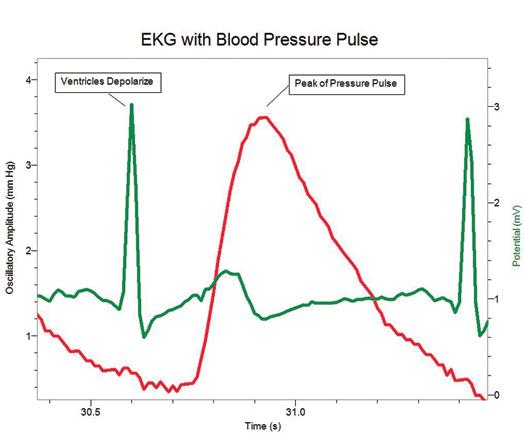
An electrocardiogram (ECG or EKG) is a graphical recording of the electrical events occurring within the heart. In the healthy heart, there is a pacemaker in the right atrium (the sinoatrial node) that initiates an electrical sequence of events in the heart. This impulse then passes between the atria to the atrioventricular node, and from there to the ventricles. The ventricles depolarize and contract, producing the peak blood pressure within the circulatory system.
If you measure arterial blood pressure while you perform an EKG, you should see that each QRS complex of the EKG will occur just before a pressure pulse occurs in an artery. This is a common exercise or demonstration in college physiology courses. As shown in the graph provided, you can easily demonstrate this to your class using Logger Pro software. All you need is a Blood Pressure Sensor, an EKG Sensor, and an appropriate Vernier interface (LabQuest, LabQuest Mini, or LabPro).
Download Logger Pro instructions to measure blood pressure and EKG simultaneously »
If you have any questions about this exercise or other physiology experiments, contact our Biology Staff Scientist, John Melville, at jmelville@vernier.com.