

Sharing ideas and inspiration for engagement, inclusion, and excellence in STEM
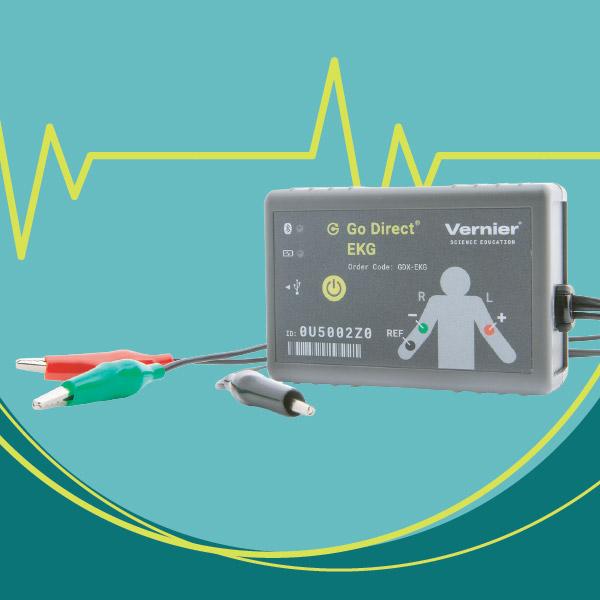
The human heart beats approximately 100,000 times a day, while our muscles contract every time we move. But what’s happening electrically inside the human body to make all of this possible? Electrocardiography (EKG) and electromyography (EMG) give healthcare professionals and researchers ways to measure this electrical activity and better understand how the body functions.
High school and college-level students can explore these physiological processes through hands-on investigations using the Go Direct® EKG Sensor. The sensor provides two separate outputs‑one optimized for standard 3‑lead EKG tracings and one optimized for surface EMG recordings—allowing students to collect and analyze real-time data as they monitor the heart’s electrical activity, investigate muscle contraction and fatigue, explore how electrode placement affects EKG recordings, and more.
Like all Go Direct sensors, the Go Direct EKG Sensor connects directly to a computer, Chromebook™, or mobile device using the Vernier Graphical Analysis® app. This gives students the freedom to wirelessly collect physiological data and explore what their data reveal about the human body.
To get started using the Go Direct EKG Sensor, here are three easy-to-implement investigations for your biology and human physiology classrooms.
Monitoring EKG
Experiment #28 from Biology with Vernier
Levels: High School and College
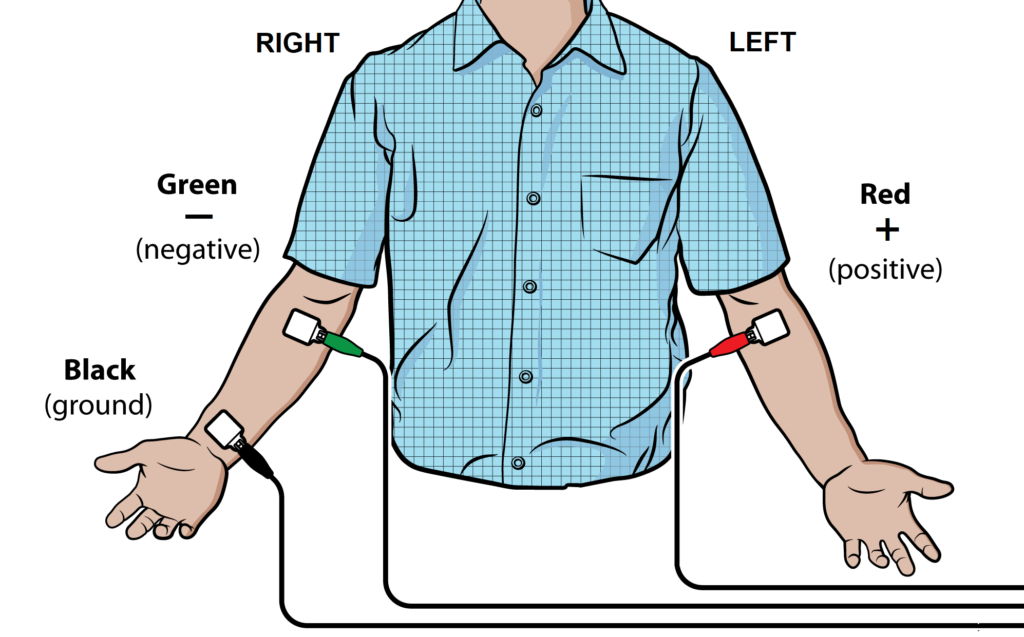
Students connect disposable electrodes to their arms and use the Go Direct EKG Sensor to record and analyze the electrical activity of their heart.
Electrocardiograms, commonly known as EKGs, help healthcare professionals understand how the heart functions. Health care professionals can use EKG recordings to examine the heart’s electrical activity and identify abnormalities that may indicate damage or disease. The distinctive waves and intervals in an EKG tracing provide information about how electrical signals move through the heart and how the heart contracts.
In this hands-on investigation, students act as healthcare professionals, using the Go Direct EKG Sensor to make a five-second graphical recording of their heart’s electrical activity. They then examine the resulting EKG tracing to identify the P wave, QRS complex, and T wave and determine the time intervals between different EKG events. Students can also use their recordings to calculate their heart rate.
By collecting and analyzing their own EKG data, students move beyond simply looking at diagrams of the heart’s electrical activity to understanding what those electrical events look like in real time.
Objectives
- Plan and carry out an experiment.
- Use the Go Direct EKG Sensor to graph the heart’s electrical activity.
- Determine the time interval between EKG events.
- Calculate heart rate based on EKG recordings.
- Analyze and interpret data.
Introduction to Electromyography
Experiment #3 from Human Physiology Experiments: Volume 1
Levels: High School and College
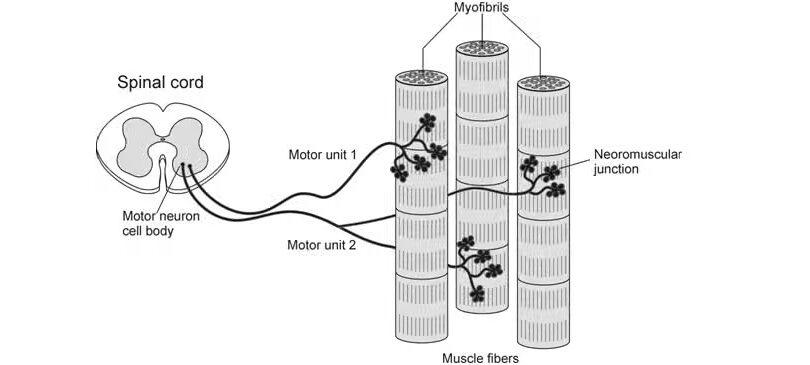
During this hands-on investigation, students explore the process of voluntary muscle contraction as electrical signals from the brain travel to individual muscle fibers and trigger contractions.
Whether you’re holding a heavy suitcase, lifting weights, or gripping a tennis racket, your muscles can only maintain a maximal effort for so long. But what happens inside your muscles as they tire out?
Muscle activation involves electrical activity that can be measured using a technique called electromyography (EMG). Measuring this activity provides insight into how muscles respond as they work and become fatigued.
In this hands-on investigation, students use the Go Direct EKG Sensor to measure the electrical activity of a muscle while using a Go Direct Hand Dynamometer to measure grip strength. They investigate how muscle electrical activity changes as the muscles become fatigued during continuous maximal effort and explore whether conscious effort affects grip strength.
Real-time data helps students explore what happens inside their muscles as they work, fatigue, and respond to conscious effort.
Objectives
- Plan and carry out an experiment.
- Obtain graphical representation of the electrical activity of a muscle.
- Correlate grip strength measurements with electrical activity data.
- Correlate measurements of grip strength and electrical activity with muscle fatigue.
- Observe the effect on grip strength of a conscious effort to overcome fatigue.
- Analyze and interpret data.
EKG and Electrode Position
Experiment #5 from Human Physiology Experiments: Volume 2
Levels: High School and College
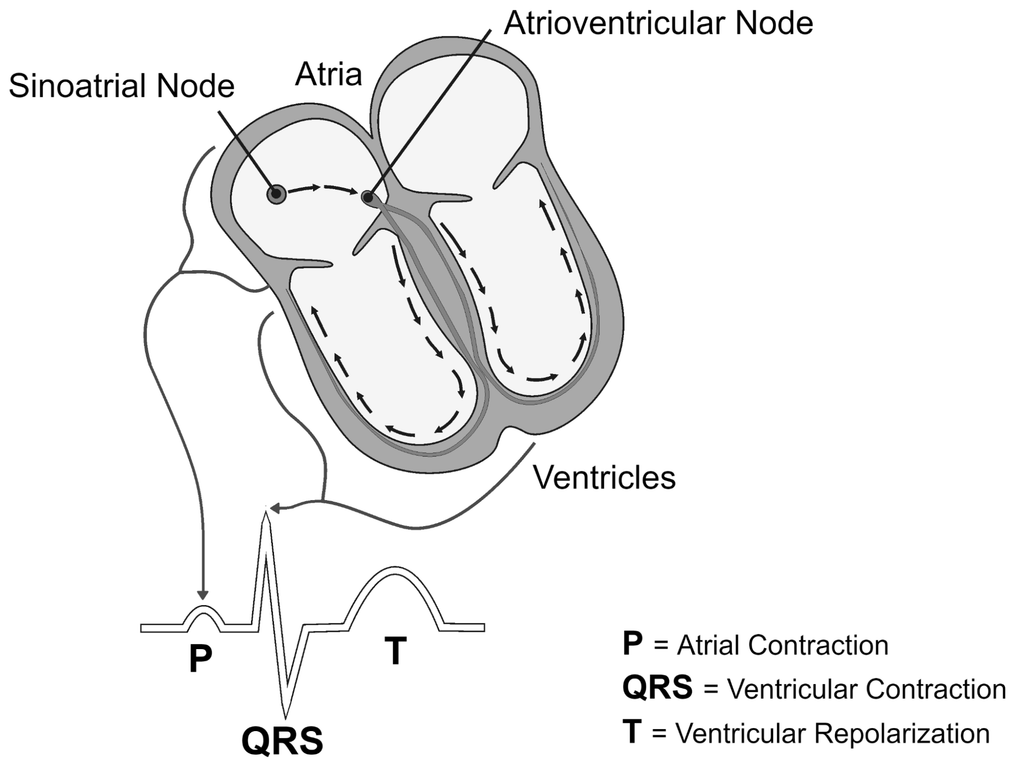
The natural conduction pathways in the heart facilitate orderly spread of the impulse and coordinated contraction of first the atria, then the ventricles. The electrical journey creates unique deflections in the EKG that tell a story about heart function and health.
When healthcare professionals record an EKG, they look at the heart’s electrical activity from multiple perspectives. Different electrode arrangements, called leads, provide various views of the heart’s electrical activity and can reveal additional information about how electrical impulses move through the heart.
In this hands-on investigation, students use the Go Direct EKG Sensor to record their own cardiac electrical activity using three different electrode arrangements. They compare the EKG results from Lead I, Lead II, and Lead III to examine how electrode position affects the appearance and amplitude of the recorded electrical signal.
Students then use the relative strength of the R waves from the different leads to approximate the electrical axis of their heart, or the general direction of their heart’s electrical activity. This gives students the opportunity to see how changing the perspective of an EKG can reveal different information about the same physiological process.
Objectives
- Plan and carry out an experiment.
- Obtain graphical representation of the electrical activity of the heart (EKG).
- Obtain graphical representation of a pressure pulse from the brachial artery.
- Calculate the transit time of a pressure pulse from the heart to the brachial artery.
- Analyze and interpret data.
Looking for more inspiration?
Sara Tallarovic, our principal science advisor, also suggests checking out Simple Neuromuscular Reflexes (Experiment #4 from Human Physiology Experiments: Volume 1). This investigation shows how the Go Direct EKG Sensor, when used alongside the Go Direct Force and Acceleration Sensor and Reflex Hammer Accessory Kit, can be used to teach neuroscience concepts as students observe the effect of central nervous system influence on reflex amplitude.
The ‘Experiments’ tab on the Go Direct EKG Sensor product page includes six additional hands-on investigations for high school and college-level students, while this video from John Melville, our college biology relationship manager, provides helpful tips for collecting EKG and EMG data.
How are you using the Go Direct EKG Sensor in your STEM classroom? Let us know what you’ve done by sharing with us on social! Questions? Reach out to support@vernier.com, call 888-837-6437, or drop us a line in the live chat.
Share this Article
Related Articles




Sign up for our newsletter
Stay in the loop! Beyond Measure delivers monthly updates on the latest news, ideas, and STEM resources from Vernier.