

Sharing ideas and inspiration for engagement, inclusion, and excellence in STEM
When students hear the word antioxidant, they may think of blueberries, raspberries, or other foods often associated with health and nutrition. But what exactly is an antioxidant—and what is it doing in a living organism?
I like that question as a starting point for exploring enzymes because it takes something students may have heard about outside the classroom and turns it into a biological phenomenon they can investigate.
In this experiment, students use a Go Direct® Gas Pressure Sensor to investigate how catalase as it breaks down hydrogen peroxide and collect evidence to help answer that question.
Phenomenon First: What Do Antioxidants Actually Do?
I’d start by asking students what they already associate with the word antioxidant. They’ve probably encountered the term on food packaging, social media, or in conversations about nutrition, even if they aren’t quite sure what it means biologically.
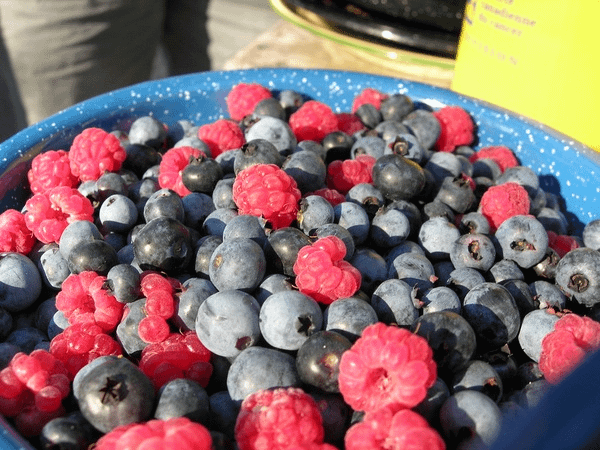
Antioxidants are often associated with foods like berries, but organisms also rely on antioxidant enzymes to protect cells. (Photo Credit: “Berries” by Dano is licensed under CC BY 2.0.)
From there, you can shift the conversation from antioxidants in food to the antioxidant defenses organisms have inside their cells. Antioxidants help protect cells from damage caused by highly reactive molecules, and some of that protection comes from enzymes. Hydrogen peroxide (H₂O₂) provides a useful example. It occurs naturally in cells as a byproduct of oxygen metabolism but can be harmful at high concentrations. Catalase, an antioxidant enzyme found in most living organisms, dramatically increases the rate at which hydrogen peroxide is converted into water and oxygen:
2 H₂O₂ → 2 H₂O + O₂
Like other enzymes, catalase acts as a catalyst, lowering the activation energy needed for a reaction to occur.
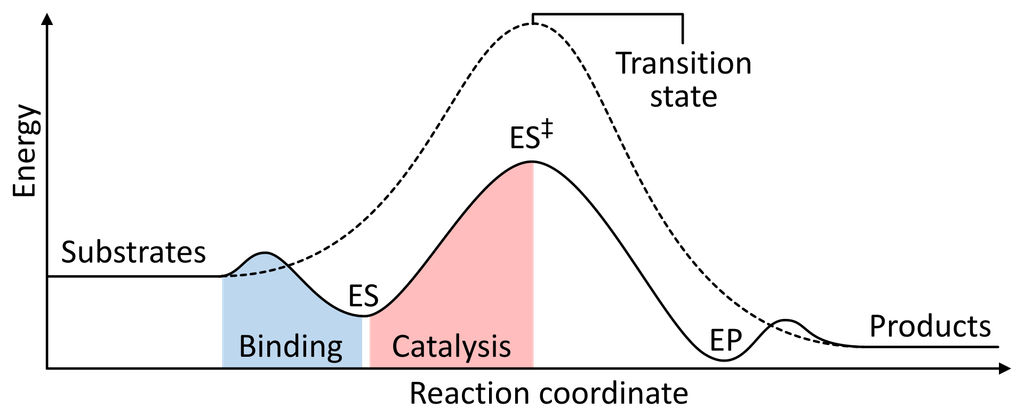
Enzymes such as catalase act as catalysts, lowering the activation energy required for a reaction. This model can help students connect what is happening at the molecular level with the reaction rates they measure experimentally.
That raises a question students can test: If cells rely on enzymes like catalase to carry out important reactions, what factors affect how quickly those enzymes can do their jobs? How could we use the oxygen being produced to figure out how quickly catalase is working? This conversation leads directly into the experimental setup.
Investigation Overview
This experiment gives students a measurable way to investigate an otherwise invisible biological process: enzyme activity. Students use catalase to break down hydrogen peroxide and measure the resulting increase in gas pressure with a Go Direct Gas Pressure Sensor. This allows them to investigate how different conditions, including enzyme concentration and temperature, affect the reaction rate.
The investigation naturally connects to core biology concepts and science practices:
- Enzyme activity and biological catalysts
- Factors that affect reaction rates
- Analyzing and interpreting data
- Cause-and-effect relationships
- Developing and using models
NGSS Connection
HS-PS1-5: Apply scientific principles and evidence to provide an explanation about the effects of changing the temperature or concentration of the reacting particles on the rate at which a reaction occurs.
Materials Needed
- Go Direct Gas Pressure Sensor with included rubber stopper and plastic tubing
- device running Vernier Graphical Analysis®
- 3% H2O2 and a catalase source (such as prepared yeast, liver, or purified catalase)
- 3 test tubes and rack, 10 mL graduated cylinder, and Beral pipettes
- beaker, ice, and Go Direct Temperature Probe (or thermometer) for creating temperature-controlled water baths
Experiment Setup
Students place hydrogen peroxide and a source of catalase in a sealed test tube connected to a Go Direct Gas Pressure Sensor. You can use purified catalase or a biological source of the enzyme, such as yeast or liver. As catalase speeds up the breakdown of hydrogen peroxide, oxygen accumulates in the test tube and pressure increases.
Students collect the change in pressure over time in Vernier Graphical Analysis. By examining the slope of the pressure vs. time data, they can compare reaction rates under different experimental conditions.
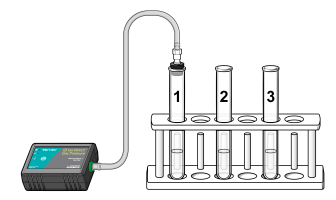
As catalase breaks down hydrogen peroxide, oxygen accumulates in the sealed test tube. A Go Direct Gas Pressure Sensor measures the resulting change in pressure over time, giving students quantitative evidence of enzyme activity.
Teacher Tip: Test your catalase preparation before students begin. Enzyme activity can vary depending on the source and preparation, so you may need to adjust the concentration if the reaction proceeds too quickly or too slowly. If you’re using yeast, keep the suspension on a stir plate and have students draw from the center so each sample has a consistent amount of yeast. Fresh hydrogen peroxide also gives a stronger reaction.
Investigation 1: How Does Enzyme Concentration Affect Reaction Rate?
Start by having students investigate how enzyme concentration affects reaction rate.
Students prepare three test tubes with equal amounts of hydrogen peroxide and water. For each trial, they add a different amount of the same enzyme suspension (one, two, or three drops) to vary the enzyme concentration while keeping the other conditions constant. After adding the enzyme, students immediately seal the test tube, gently swirl to mix, connect the Gas Pressure Sensor, and collect pressure data for three minutes. Small bubbles forming at the surface of the solution are a quick visual sign that the catalase is active.
Before collecting data, ask students to predict: How will increasing enzyme concentration affect the reaction rate? What do you expect to see in the pressure vs. time data?
After each trial, students select a linear region of their pressure vs. time graph and apply a linear fit. The slope provides a quantitative measure for comparing reaction rates. They can then compare rates across enzyme concentrations instead of relying on a qualitative observation like “this test tube bubbled more.”
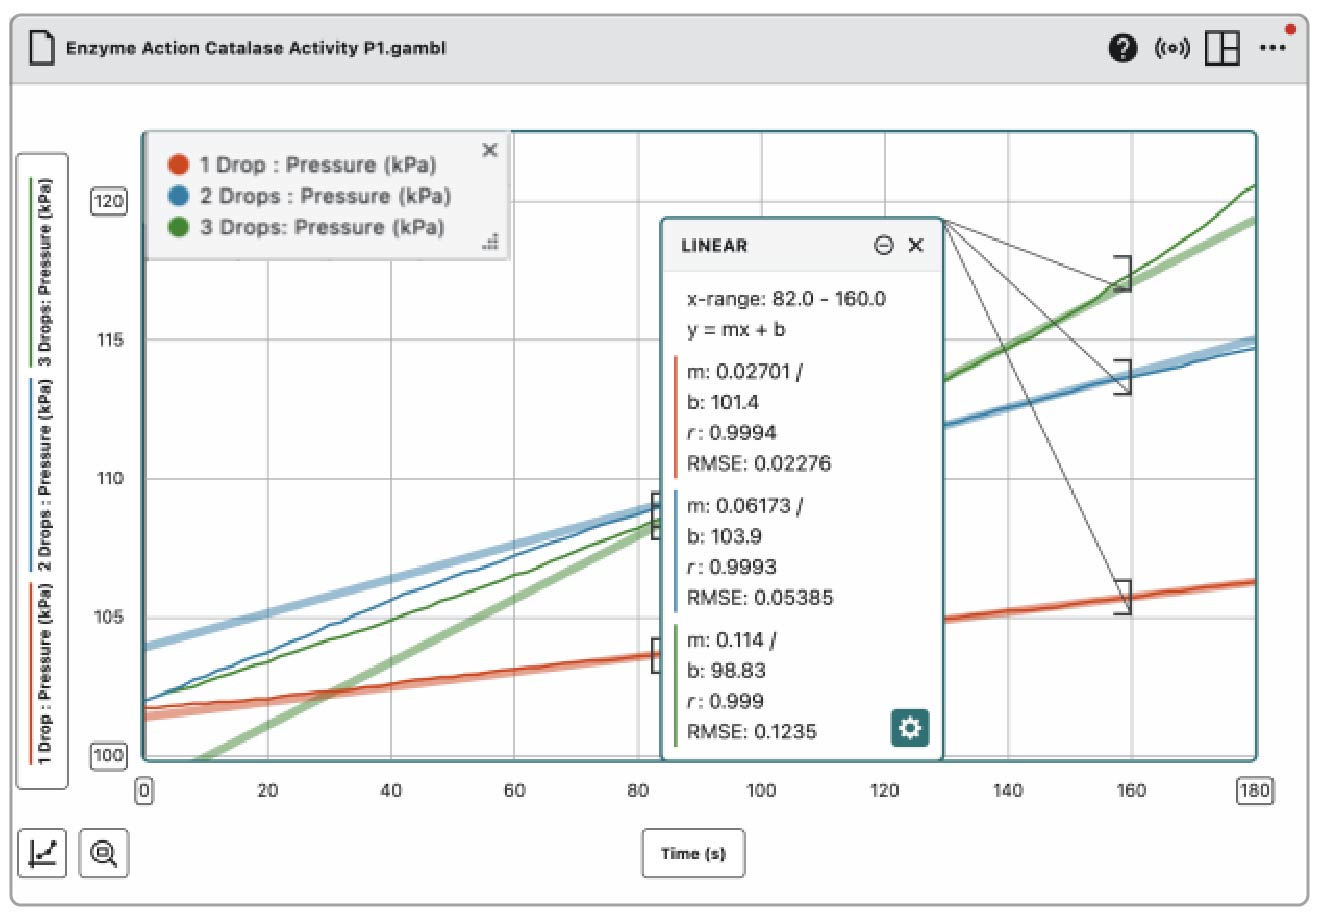
Here is pressure vs. time data collected using three different amounts of enzyme suspension. In Graphical Analysis, students apply a linear fit to each data set and use the slope (m) to compare the reaction rate. Comparing the slopes shows how reaction rate changes as enzyme concentration increases.
Teacher Tip: Have students watch the pressure reading during data collection. If it climbs above 130 kPa, the stopper is likely to pop off, so students should disconnect the tubing from the sensor. If this happens often, dilute your enzyme suspension.
Investigation 2: How Does Temperature Affect Catalase Activity?
Next, have students investigate how temperature affects the reaction rate. The experiment uses four temperature ranges: approximately 0–5°C, 20–25°C, 30–35°C, and 50–55°C. These conditions can be created using an ice-water bath, room-temperature water, warm water, and hot water. Hot tap water is often in the 50–55°C range. If yours isn’t, prepare hot-water baths ahead of time. Remind students to be careful and not to touch the hot water.
Assign each lab group one temperature range, or have groups test multiple temperatures if time allows. Students prepare test tubes with equal amounts of hydrogen peroxide and water, place them in the appropriate water bath for about three minutes, and record the temperature. For each trial, they add two drops of enzyme suspension, immediately seal the test tube, and collect pressure data for three minutes. Have students complete three trials at their assigned temperature and calculate the average reaction rate.
Before collecting data, ask students to predict: How will temperature affect the reaction rate? What pattern do you expect to see when reaction rate is graphed against temperature?
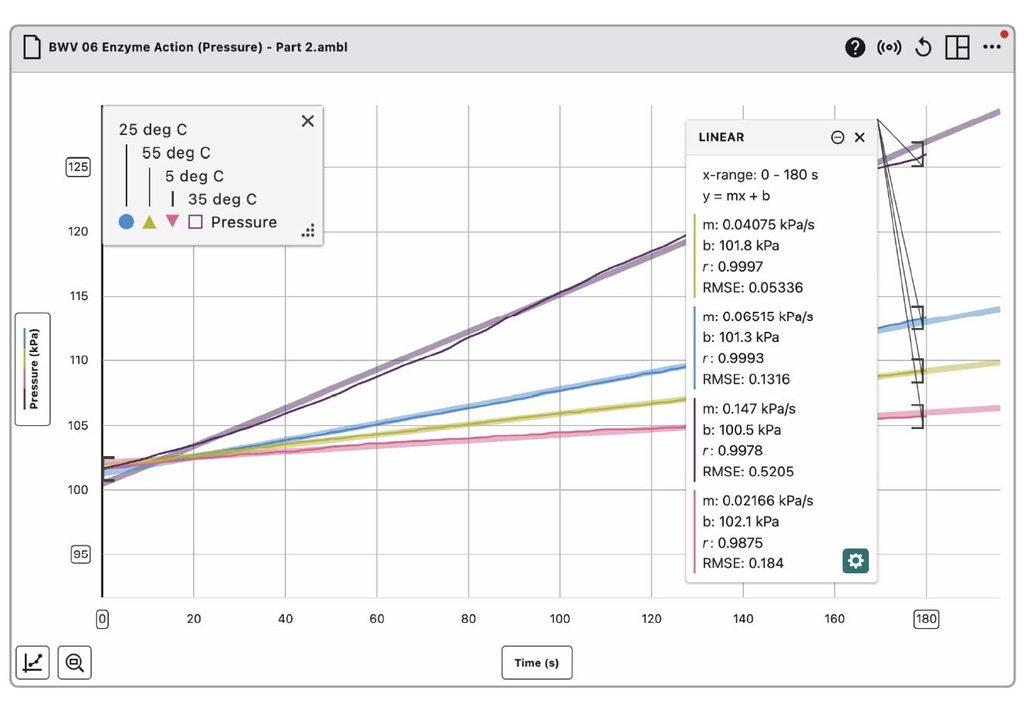
Pressure vs. time data for catalase reactions at four temperatures. In Graphical Analysis, students apply a linear fit to each data set and use the slope (m) to determine the reaction rate. Comparing the slopes shows how catalase activity changes with temperature.
If groups are assigned different temperatures, combine their averages into a shared class data set. This allows students to compare reaction rates across all four temperature ranges without every group having to collect data for every condition.
Bring It Back to the Antioxidant Phenomenon
After students analyze both data sets, return to the opening question: What do antioxidants actually do?
Have students use their catalase data to explain how an antioxidant enzyme helps cells manage hydrogen peroxide. A simple claim-evidence-reasoning prompt works well here:
- Claim: What does catalase do?
- Evidence: What result from your investigation supports your claim?
- Reasoning: How does that evidence help explain catalase’s role in living cells?
Teacher Tip: Save students’ initial responses to the antioxidant question. At the end of the investigation, have them revise their original explanation using evidence from their data. It’s a quick way to make changes in their thinking visible.
Let Students Extend the Investigation
Once students understand the setup, give them a new variable and let them design the next investigation.
- Catalase source: Compare catalase activity from different organisms, such as yeast, liver, or potato.
- Substrate concentration: Investigate how changing the concentration of hydrogen peroxide affects reaction rate.
- Boiled catalase: Compare boiled and unboiled enzyme to test students’ explanation of the effects of high temperature.
- Time: Calculate reaction rates over successive 30-second intervals and look for changes during the reaction.
For AP, IB, or introductory college courses, have students identify their variables and controls, determine how many trials they need, and decide how they will calculate and compare reaction rates before collecting data. You can also introduce pH as a variable that affects reaction rates with the Go Direct pH Sensor.
Try the Experiment with Your Students
Ready to use this investigation with your students? Watch this quick overview video, then download the complete Enzyme Action: Testing Catalase Activity experiment. It includes the full student procedure, data tables, analysis questions, and instructor information for using either the Go Direct Gas Pressure Sensor or the Go Direct O2 Gas Sensor.
Looking for more ways to make cellular processes visible through hands-on data collection? Explore Vernier biology resources.
Let us know if you give this investigation a try in your classroom and share with us on social.
Questions? Email biology@vernier.com, call 888‑837‑6437, or our use our live chat.
Share this Article
Related Articles





Sign up for our newsletter
Stay in the loop! Beyond Measure delivers monthly updates on the latest news, ideas, and STEM resources from Vernier.