Sharing ideas and inspiration for engagement, inclusion, and excellence in STEM
Spectroscopy isn’t just a tool for measuring light—it’s also a powerful way to help students understand core biological processes! While many biologists may see spectrometers as just “black boxes,” these hands-on tools are an engaging, easy-to-use way to help students explore real-world phenomena and visualize complex biological systems—from plant pigments and photosynthesis to proteins and evolution!
Not sure how to incorporate spectrometers in your classroom or lab? Try these three experiments, ranging from introductory to more advanced, all suitable for high school and college students. Each experiment can be done with our popular entry-level spectrometer the Go Direct® SpectroVis® Plus along with our free Vernier Spectral Analysis® app.
1. The Visible Spectra of Plant Pigments
Experiment 14 from Investigating Biology through Inquiry
In plants, pigments like chlorophyll play a key role in photosynthesis, the process by which plants convert light into energy. Chlorophyll, found in the chloroplasts of plant cells, absorbs light in specific wavelengths. In a spinach leaf, for example, chlorophyll absorbs light most notably in the blue (400–500 nm) and yellow-red (600–700 nm) range of the visible light spectrum. The light that chlorophyll doesn’t absorb—mainly in the green range—is reflected. That’s what makes spinach (and many plants) green to the human eye!
What You’ll Need
- Go Direct SpectroVis Plus Spectrophotometer
- Device with Vernier Spectral Analysis
- 70% isopropanol
- Spinach leaves (or other leafy greens)
- Food coloring (blue and yellow)
- Lab gloves and protective equipment
What Students Will Do
In this simple experiment, students extract chlorophyll from spinach or other leafy greens using 70% isopropanol. Then, they use the Go Direct SpectroVis Plus Spectrophotometer to analyze the absorption peaks of chlorophyll A and B.
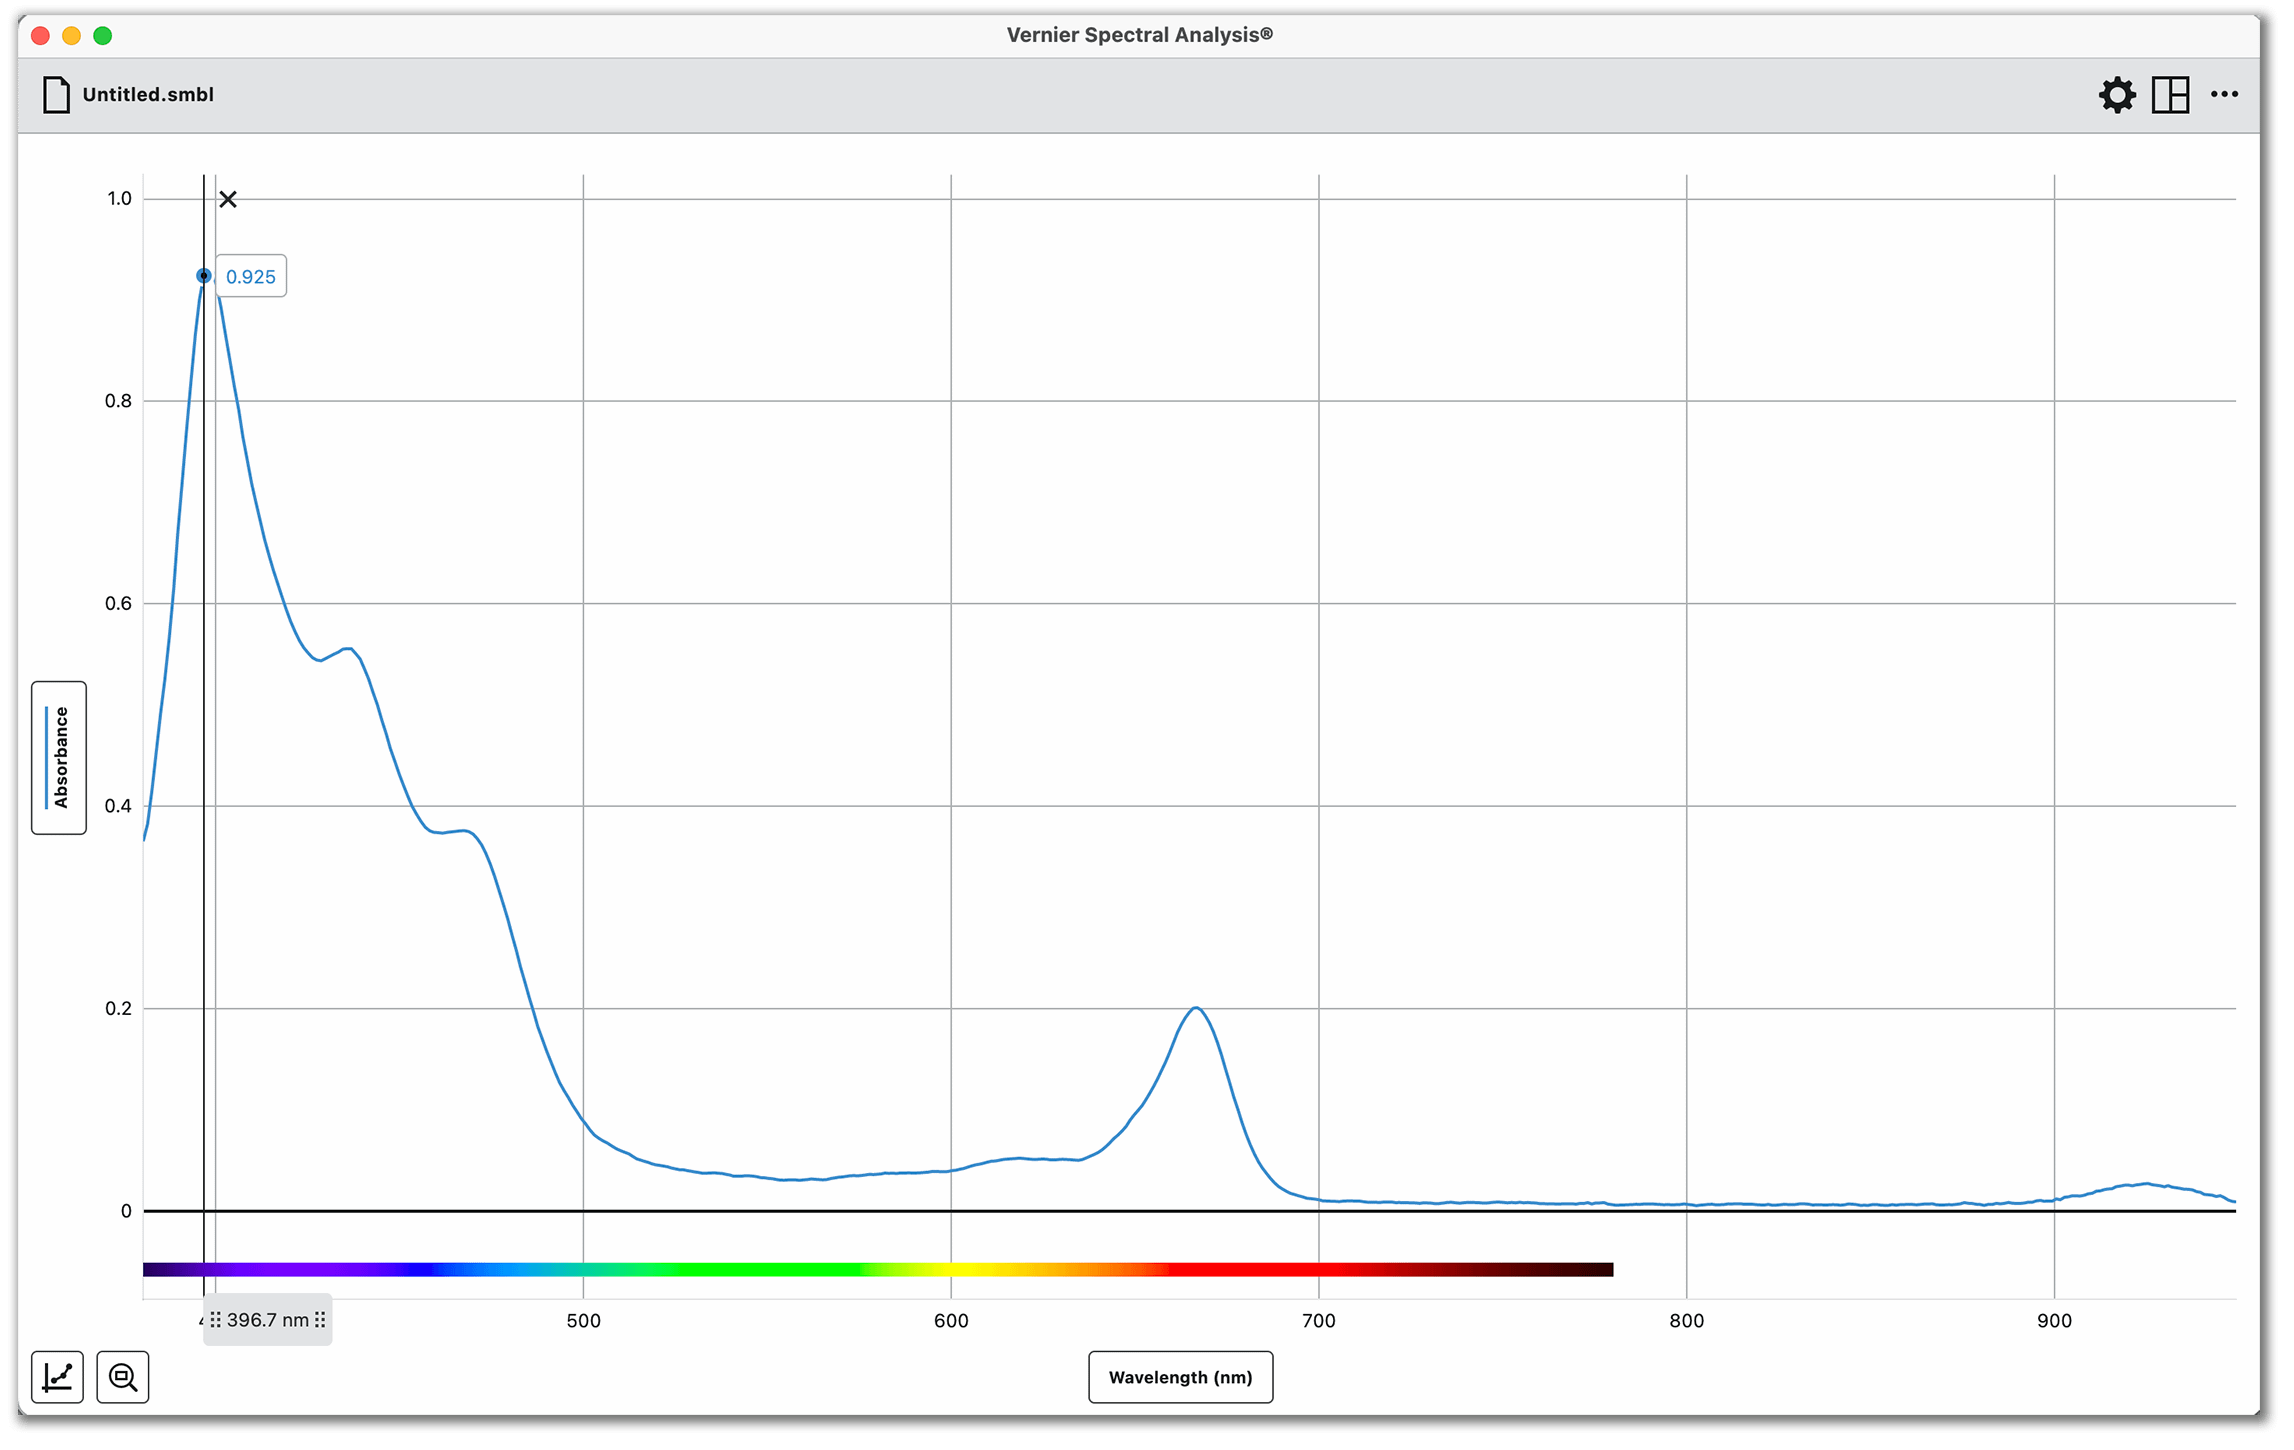
Absorption peaks of chlorophyll A and B collected with a Go Direct SpectroVis Plus and graphed in Vernier Spectral Analysis
How It Supports 3D Standards
This experiment introduces biology students to visible light spectrum analysis and the absorption characteristics of plant pigments. It also helps students understand how plants absorb light and convert it into energy.
Tips
- For better accuracy, ensure samples are sufficiently diluted. Stay within the spectrophotometer’s optimal linear range (0–1 absorbance).
- Extend the activity by exploring the absorbance of carotenoids and anthocyanins, pigments that help with UV protection and pollination.
Download the student directions for free!
2. Investigating Protein: The Bradford Assay
Experiment 5 from Investigating Biology through Inquiry
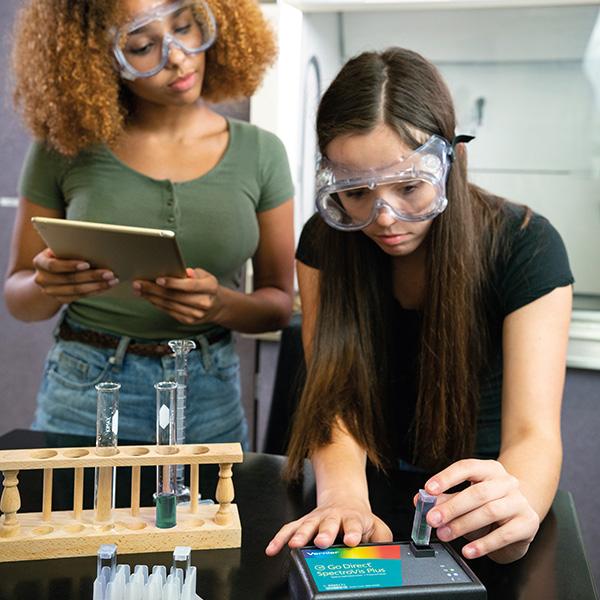
Proteins are more than just a nutritional label on your favorite gym drink—they’re essential macromolecules involved in almost every single biological function in every single living organism! Whether building muscles, fighting off infections, catalyzing biochemical reactions, or supporting cell structure, proteins play a crucial role. This experiment introduces the Bradford protein assay, a widely used method for quantifying protein levels in everything from food products to blood samples. The assay uses Coomassie dye that binds to amino acids in proteins, changing color in the process. By measuring this color change with a spectrophotometer, students can quantify protein concentration.
Students use the Bradford protein assay to determine the protein content of an unknown sample.
What You’ll Need
- Go Direct SpectroVis Plus Spectrophotometer
- Device with Vernier Graphical Analysis® and Vernier Spectral Analysis
- Bio-Rad® Got Protein? Kit (or other Bradford protein assay standards)
- Milk (regular, soy, and/or almond milk)
- Lab gloves and protective equipment
What Students Will Do
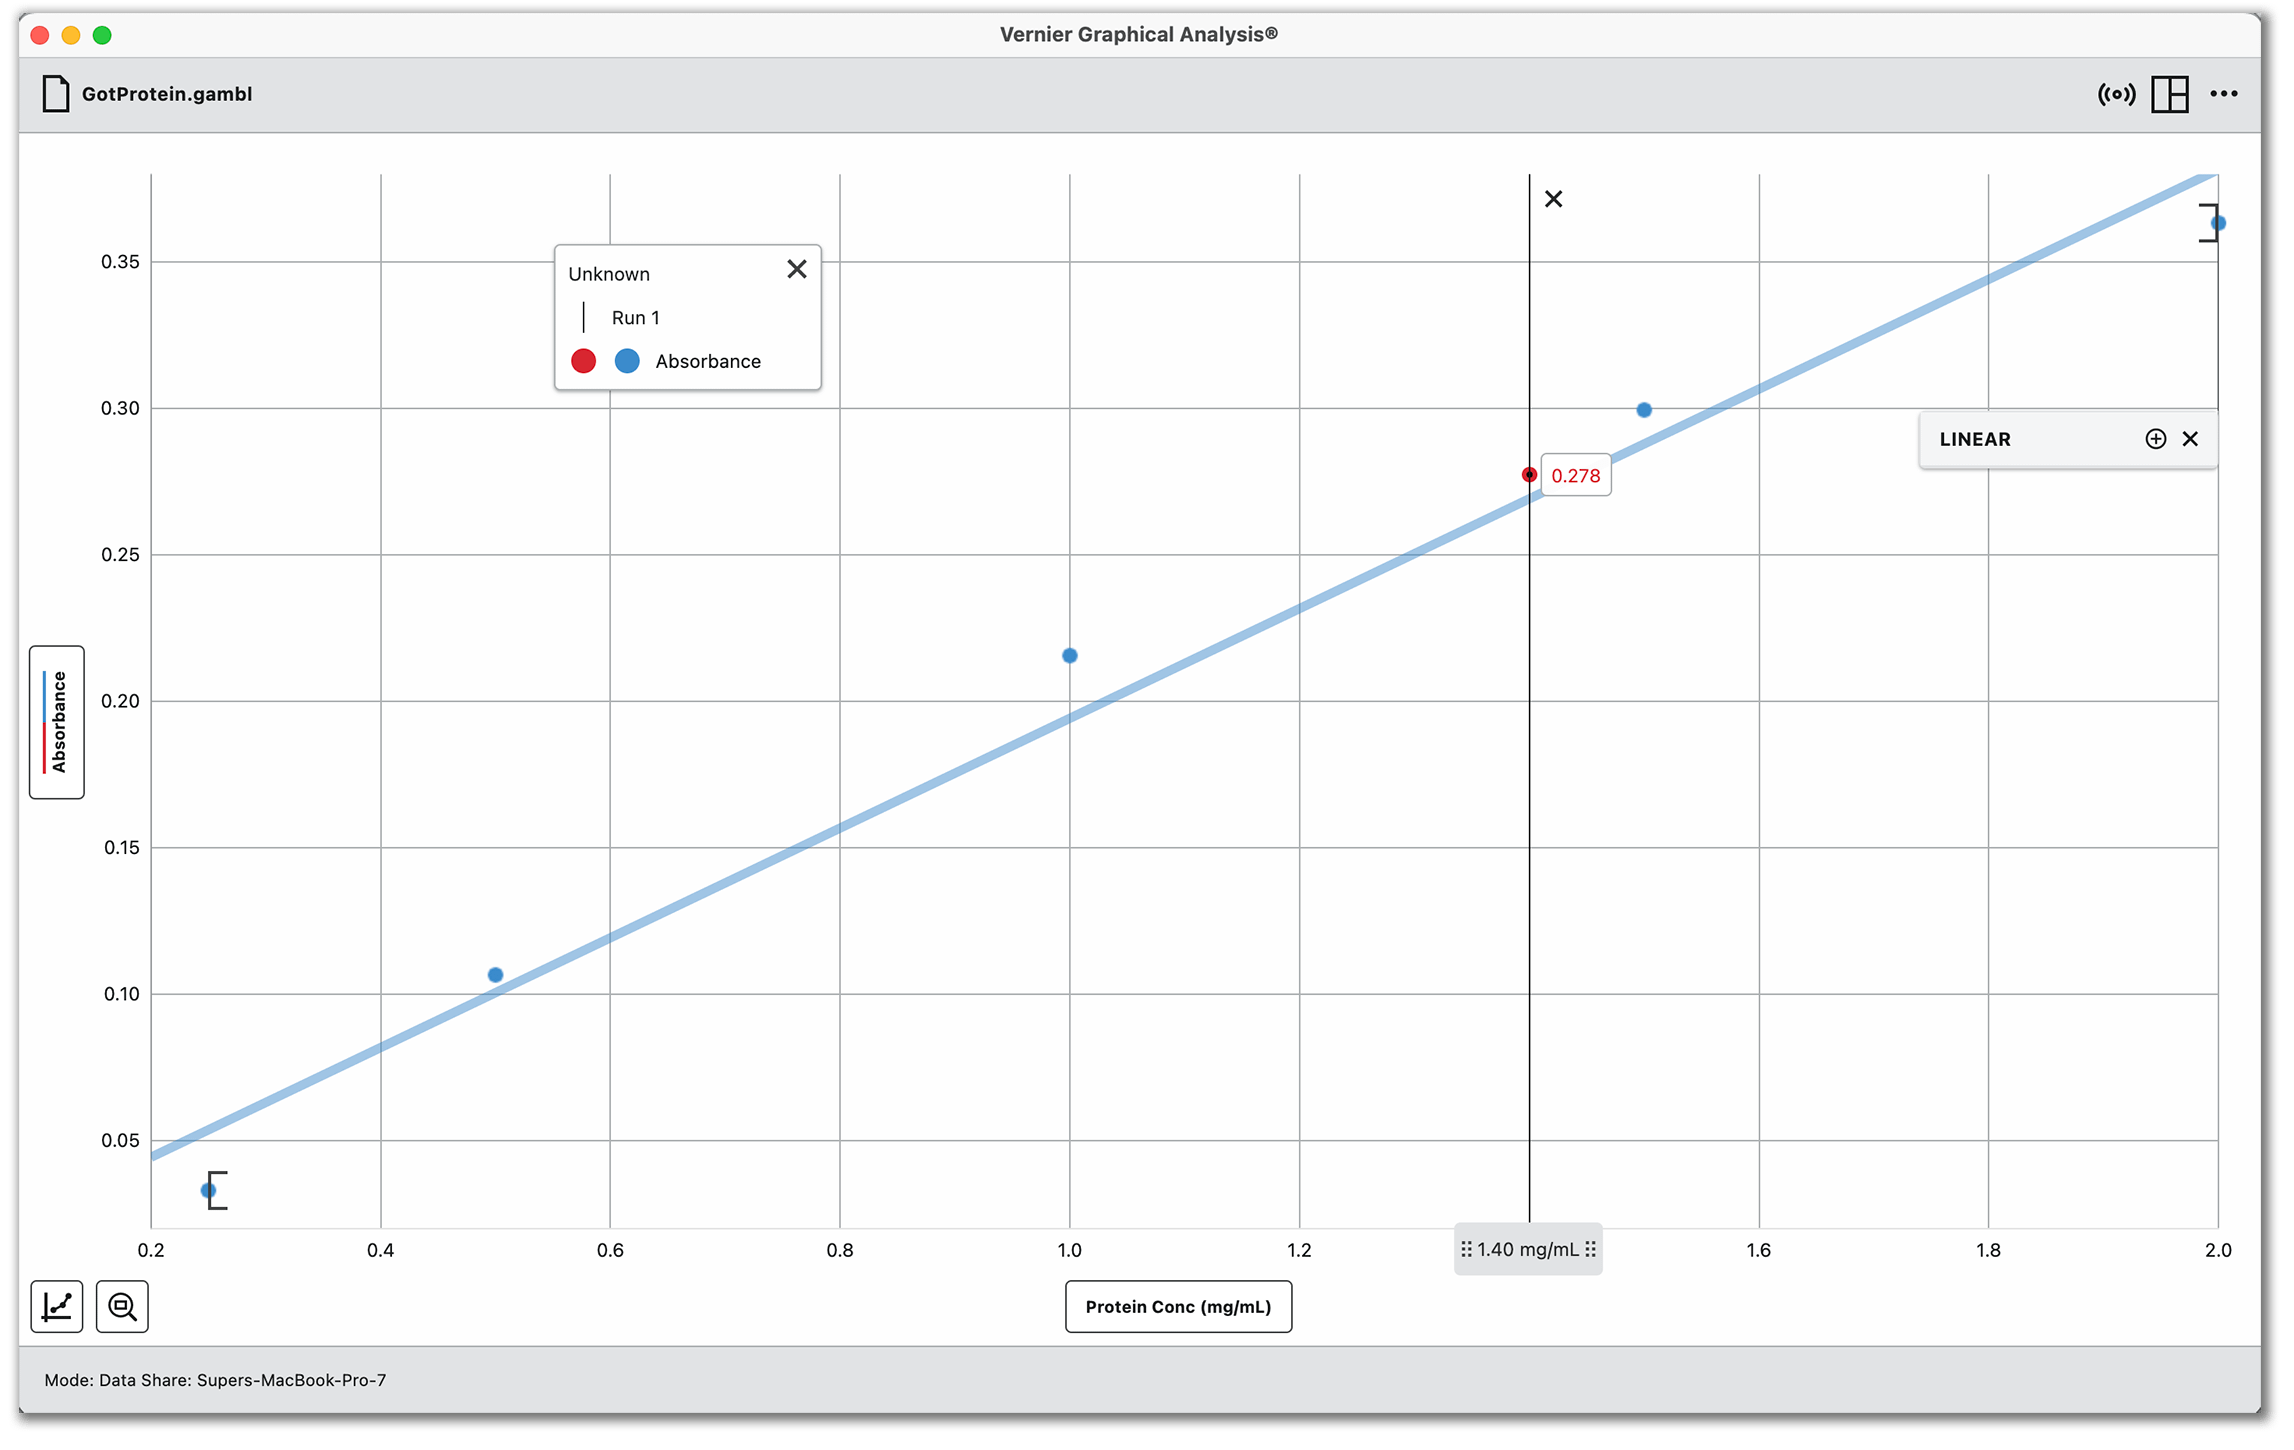
In this experiment, students use the Bradford protein assay to determine the protein content of milk as a preliminary activity. The Coomassie dye reacts with amino acids in proteins, causing a color change from brown to blue. Students measure the absorbance at 595 nm to create a standard curve in Vernier Graphical Analysis and quantify protein concentration. In the open inquiry experiment, students design and investigate related questions, looking at the protein contents of other consumables, such as hemp or pea protein products.
Sample data from the preliminary activity using the Bradford protein assay to determine protein content in milk samples
How It Supports 3D Standards
This experiment builds on student knowledge of protein structure and its biological significance in different processes while using mathematical models and data analysis. It also offers hands-on experience with common lab techniques used in research and industries like biotechnology, food science, and healthcare.
Tips
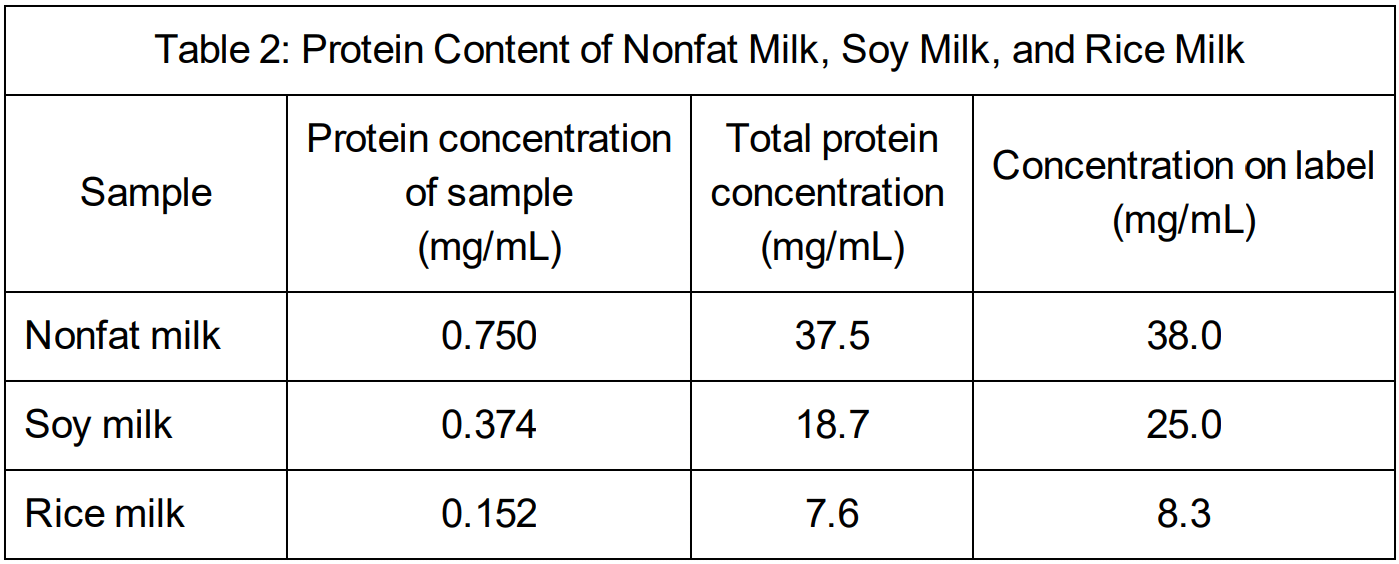
- Try using different types of milk, like soy or almond milk, to compare protein concentrations and extend learning into food science.
- For more advanced students, introduce and discuss Beer’s law.

Watch our webinar recording for a full demonstration of this experiment and additional ideas for extending investigations into the protein of animal and plant-based “milks.”
3. Evolution of Cellobiase in Fungi
Experiment #20 from Investigating Biology through Inquiry
What do mushrooms and biofuels have in common? Enzymes! Fungi, including mushrooms, have evolved to break down plant material for food, using enzymes like cellobiase to process cellulose found in plant cell walls. Cellobiase breaks down cellulose into glucose, which fungi use as an energy source. Different species of mushrooms, adapted to unique ecological niches, produce varying amounts of cellobiase depending on their environment. For example, shiitake mushrooms grow on dense wood and require higher cellulase activity to break it down. In contrast, chanterelles, a type of mycorrhizal fungi, grow in symbiosis with oak tree roots—too much cellulase activity could damage the roots they depend on for food. Understanding how fungi have evolved to process cellulose can lead to innovations in biofuel production, where enzymes like cellobiase are used to break down plant materials into fuel alternatives.
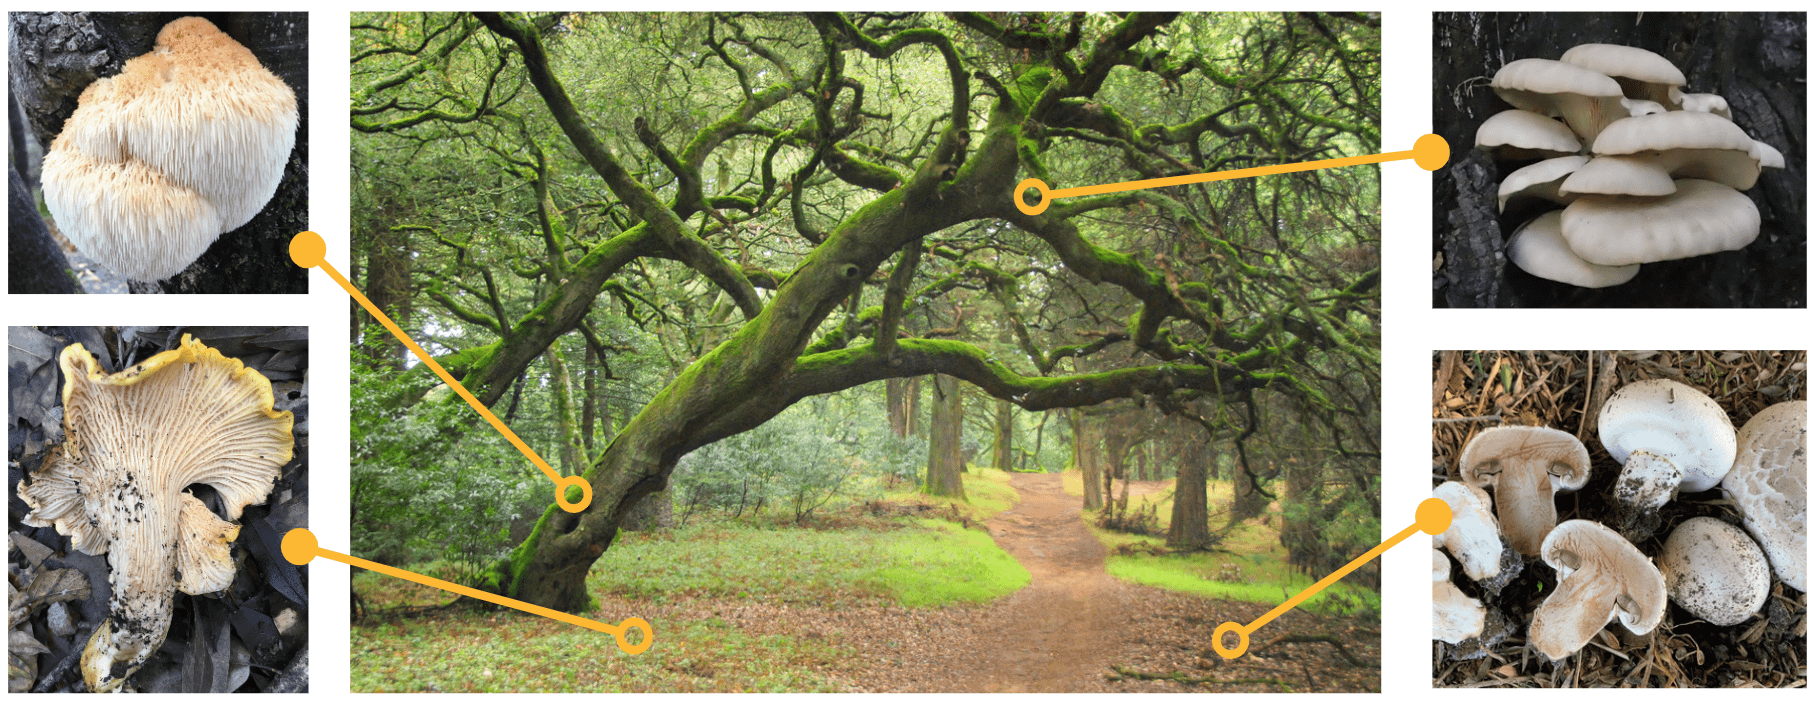
What can a mushroom’s ecological niche tell us about its potential cellulase activity? Image provided by Bio-Rad.
What You’ll Need
- Go Direct SpectroVis Plus Spectrophotometer
- Device with Vernier Graphical Analysis and Vernier Spectral Analysis
- Fungal cultures (e.g., button mushroom, shiitake mushroom, and chanterelle)
- Bio-Rad Biofuel Enzyme Kit
- Lab gloves and protective equipment
What Students Will Do
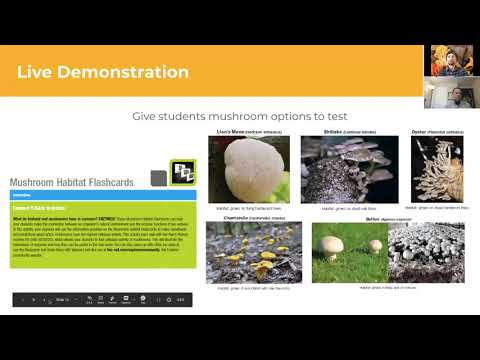
Students start by taking a look at how mushroom species grow locally in their environment. Based on their habitat, do students think they would process more cellulose or not? Students then test the cellobiase activity of various fungi species by measuring the breakdown of an artificial substrate, p-nitrophenyl glucopyranoside, which produces a color change when broken down into p-nitrophenol. This color change, measured with the Go Direct SpectroVis Plus, allows students to track enzyme activity and understand how fungi’s enzyme production can be applied to sustainable biofuel research.
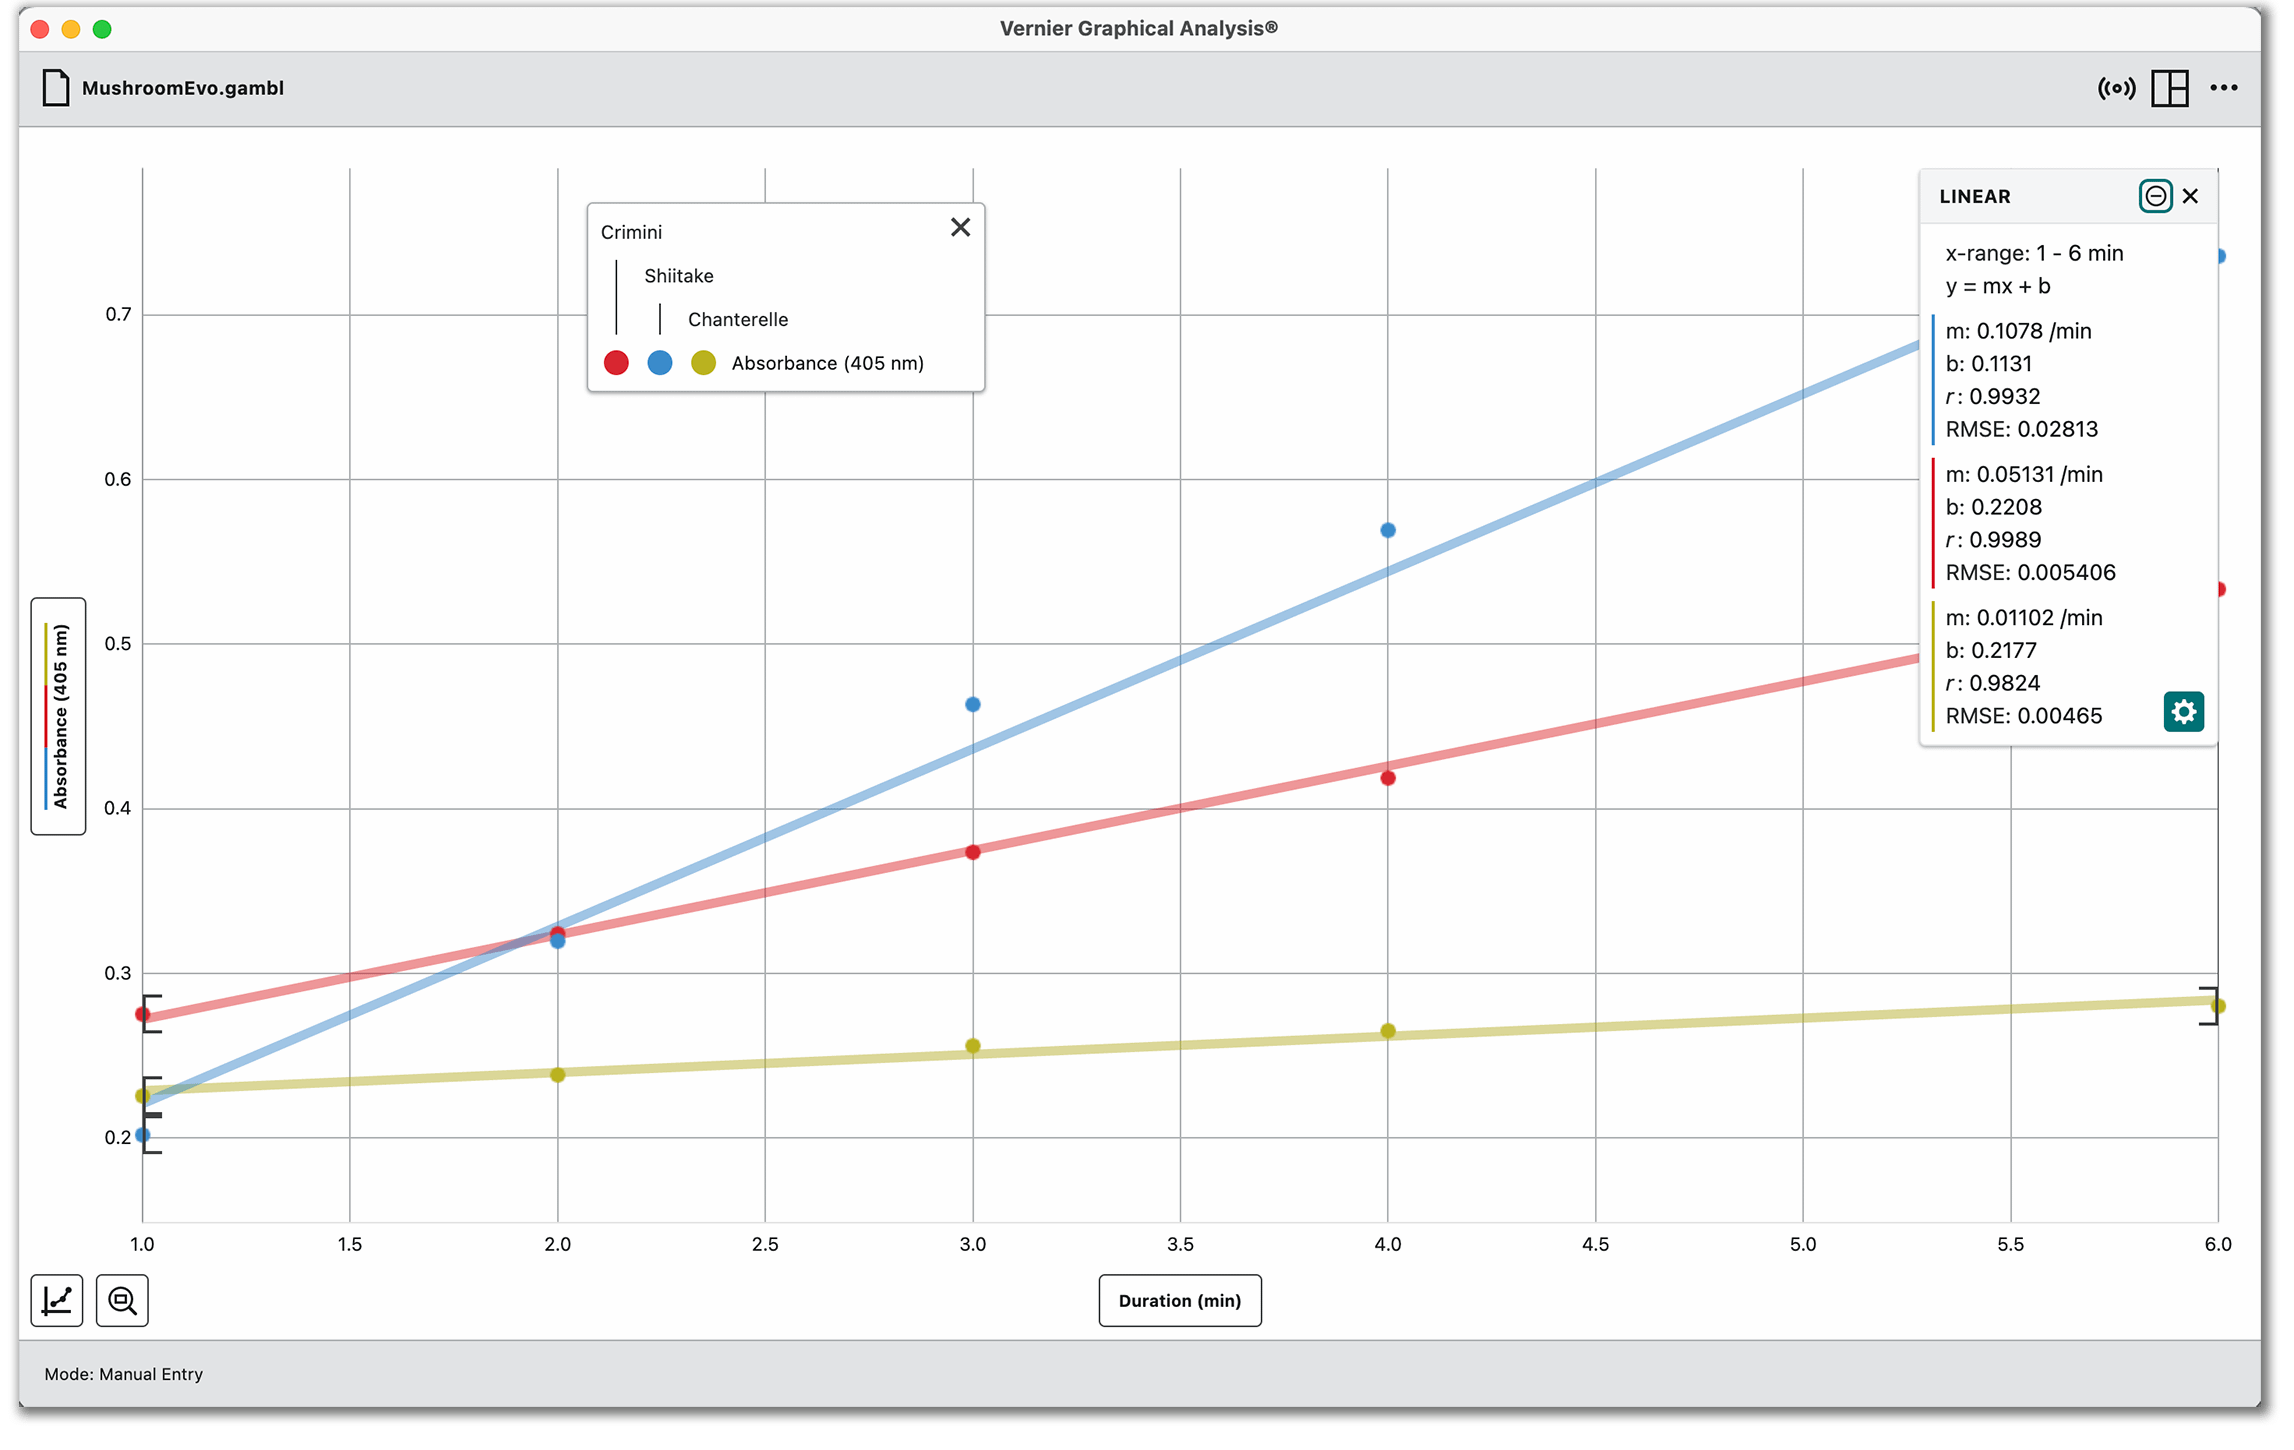
For advanced analysis, use Beer’s law to determine initial reaction rates in three mushroom types with linear curve fits in Graphical Analysis.
How It Supports 3D Standards
This experiment connects evolution, ecology, and biotechnology by showing how fungi have evolved to produce cellulase enzymes for breaking down cellulose. Understanding these evolutionary adaptations helps students apply this knowledge to biofuel production, where cellulase enzymes are used as one of the steps in converting plant materials into ethanol. The experiment also provides hands-on experience with using spectroscopy to explore enzyme kinetics.
Tips
- The reaction being studied in this investigation is very temperature sensitive. Be sure to bring all reagents to room temperature before use.
- For advanced students, explore the roles of different cellulase enzymes in biofuel production.
Watch our webinar for a full demonstration of testing cellulase activity in fungi using the Go Direct SpectroVis Plus and Bio-Rad kits.
How will you use spectroscopy to inspire learning in your biology classroom or lab? Let us know and share with us on social! Questions? Reach out to biology@vernier.com, call 888-837-6437, or drop us a line in the live chat.
Share this Article
Related Articles


Sign up for our newsletter
Stay in the loop! Beyond Measure delivers monthly updates on the latest news, ideas, and STEM resources from Vernier.