Sharing ideas and inspiration for engagement, inclusion, and excellence in STEM
Getting students genuinely curious about optics can be a challenge. But when they can point to the lens in their smartphone camera, the prescription in their glasses, or the aperture on a DSLR and say “I understand how that works”—that’s when the unit clicks. These two experiments from Advanced Physics with Vernier—Beyond Mechanics provide a rigorous, hands-on foundation for your waves and optics unit—whether you’re teaching physical science, AP physics, or an introductory college course—and in this post, we’ll share some of our favorite ways to connect them to phenomena your students already encounter every day.
Both labs use the Vernier Optics Expansion Kit, which mounts directly onto the Dynamics Cart and Track System you may already have in your classroom. If you’ve been looking for a reason to put that track to work beyond mechanics, this is it.
1. Thin Lenses and Real Images
Experiment #16 from Advanced Physics with Vernier—Beyond Mechanics
How does your eye—or a camera—actually focus an image?
Every time you take a photo, put on glasses, or look through a telescope, a lens is bending light to bring an image into focus. But how does changing the distance between a lens and an object change where the image forms? And is there a mathematical relationship students can find for themselves—rather than just memorize?

This PBS video comparing how the human eye and a camera lens form images makes a great phenomenon introduction before students begin the lab.
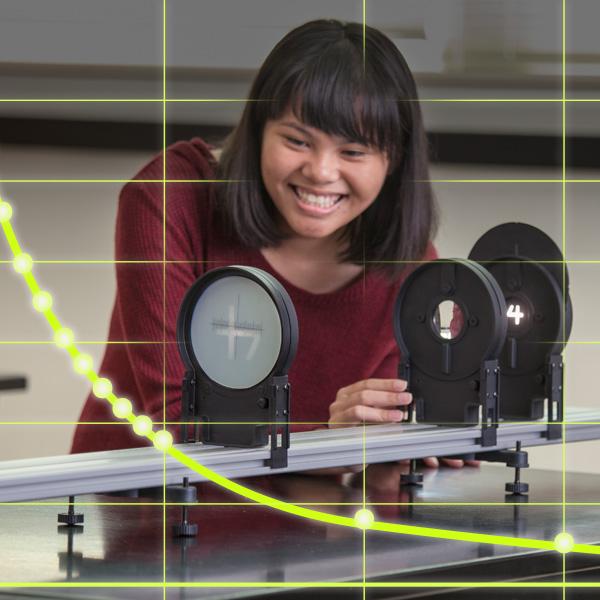
In this guided inquiry investigation, students derive the thin lens equation from their own data. Using the Vernier Optics Expansion Kit mounted on the Combination Dynamics Track and Optical Bench, students project a real image of a small illuminated object through a double convex lens onto a screen, vary the object distance, and record the corresponding image distance across multiple trials.
What You’ll Need
- Vernier Combination Dynamics Track and Optical Bench
- Vernier Optics Expansion Kit
- Device running Vernier Graphical Analysis®
Observe and Collect Data
Students position the light source and lens on the track, then move the screen until the projected image snaps into sharp focus. They record the object distance (the distance between the light source and the lens) and image distance (the distance between the lens and the screen), shift the lens to a new position, and repeat for at least six data points—then do it again with the second lens.
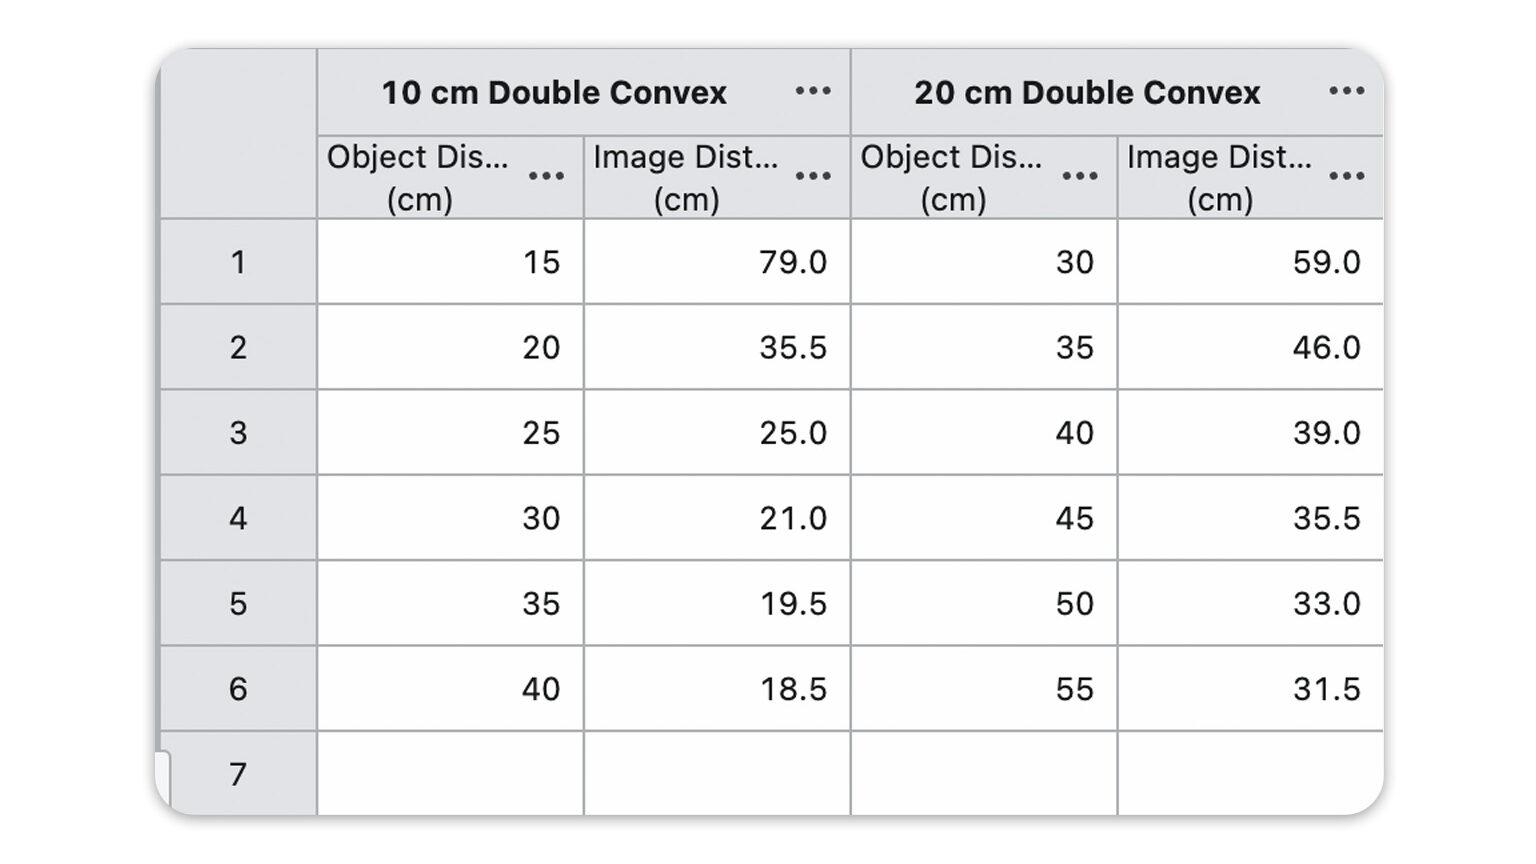
Students record data with Manual Entry in Graphical Analysis.
Evaluate and Analyze Data
When students plot image distance vs. object distance, they will see the result is a curve—not a straight line. That matters because a linear graph is much easier to interpret mathematically. The slope and intercept both carry physical meaning that a curve doesn’t reveal as cleanly. So the goal becomes finding a way to straighten the data.
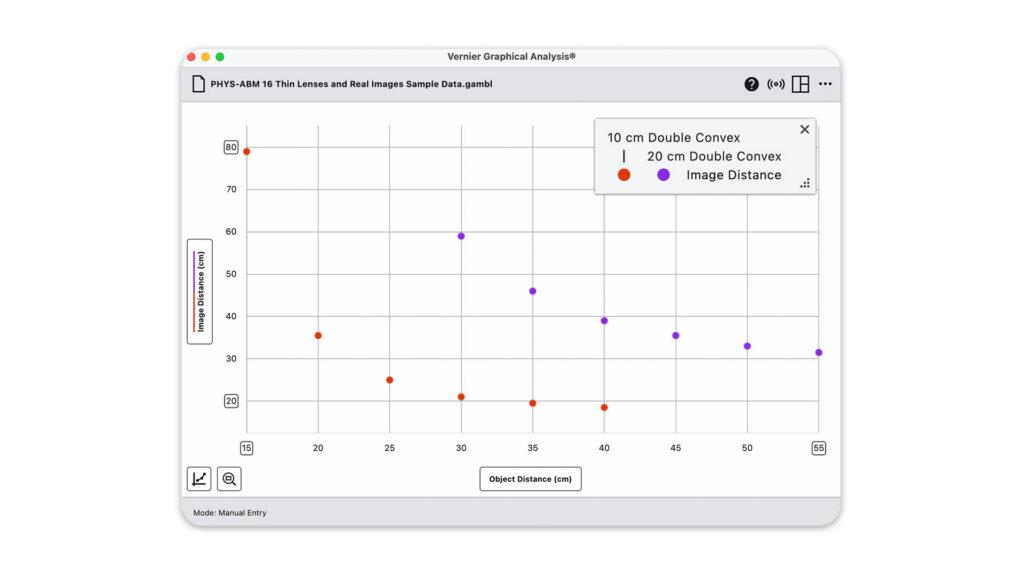
Students plot the image distance vs. object distance and discuss the resulting graph and relationship between variables.
To produce a linear relationship between variables, students use Add Calculated Column in Graphical Analysis to create a transformed version of their data—for example, 1/object distance—without re-entering anything by hand.
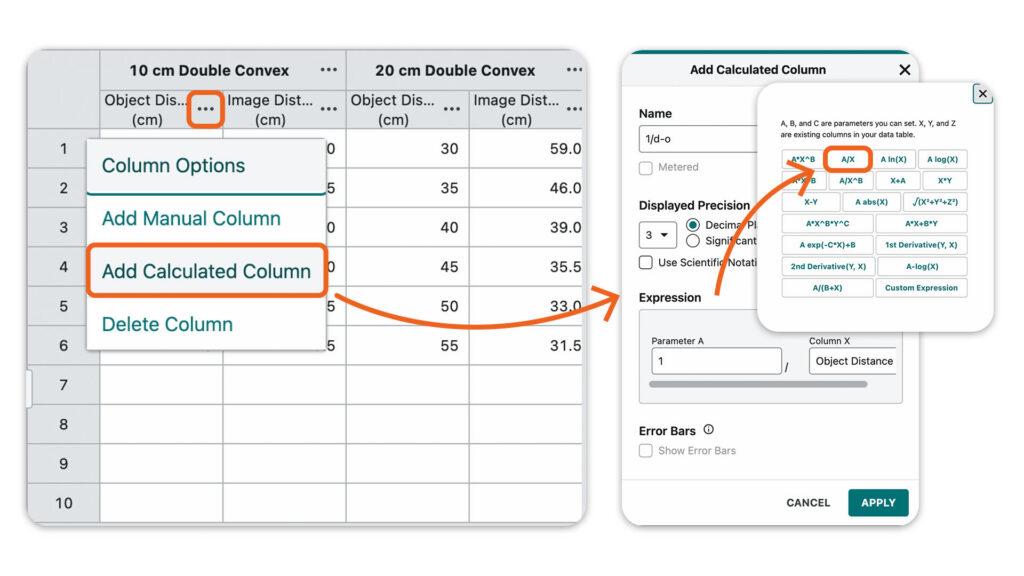
To linearize the graph, students use Graphical Analysis to add calculated columns for the reciprocal of object distance and image distance, then plot the two against each other.
Students are likely to conclude that the image distance is inversely proportional to the object distance. However, they will find that they will need to modify both variables to produce a linear graph.
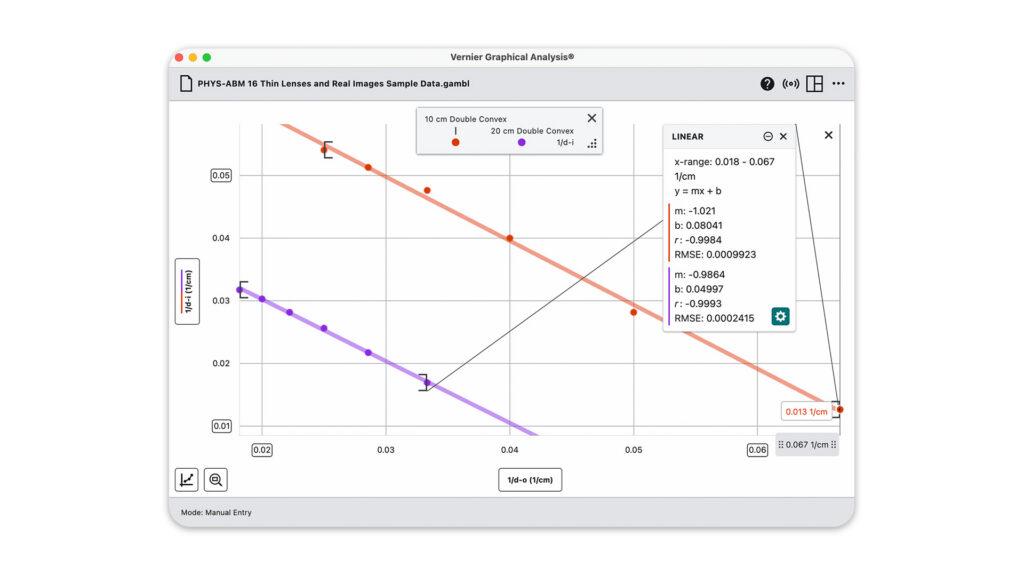
From there, students use Apply Curve Fit to find the best-fit equation for the linearized graph. The slope turns out to be very close to −1, and the vertical intercept is 1/f—the reciprocal of the focal length. Students then write the general equation describing the relationship between the object and image, and ultimately derive the thin lens equation themselves as

How It Supports 3D Standards
This experiment addresses HS-PS4-1 and HS-PS4-5. As students linearize their graphs and derive the thin lens equation, they apply the Science and Engineering Practices of Using Mathematics and Computational Thinking and Analyzing and Interpreting Data.
Tips
- Other phenomena to introduce this lesson: have students test their vision with an eye chart and discuss how a lens corrects nearsightedness or farsightedness; pass around a magnifying glass or look through a classroom telescope or microscope and ask students to describe what the lens is doing; or pull up a photo taken with a DSLR camera in manual focus mode and ask students why some parts of the image are sharp while others are blurred.
- Graphical Analysis can also run directly in a Chrome™ browser at graphicalanalysis.app, no IT installation required.
- The lenses in the Optics Expansion Kit were intentionally chosen so students can build a working telescope from the kit components and the dynamics track. It makes a satisfying extension or end-of-unit demonstration.
- A companion experiment, “Thin Lenses and Virtual Images”, uses the double concave lens included in the kit—a natural next step in the same unit.
2. Light, Brightness, and Distance
Experiment #29 from Physics with Vernier
Why does moving a light source change the look of a photo so dramatically?
What do astronomers measuring the distance to a distant star and photographers lighting the cover of Vogue have in common? Both rely on the same fundamental principle: the intensity of light drops off predictably with distance. It’s called the inverse square law, and students can find it in data they collect themselves.

This video from BYU Photo offers a great real-world application of the inverse square law as it applies to photography. You can start this lab with the video, or simply by sharing a few photo examples of the same subject lit at different distances as the anchoring phenomenon for your students.
In this experiment, students use the same light source from the optics kit alongside the Go Direct® Light and Color Sensor to measure illuminance in lux at a series of distances. Rather than memorizing the inverse square law, they derive it from their own data.
What You’ll Need
- Vernier Combination Dynamics Track and Optical Bench
- Vernier Optics Expansion Kit
- Go Direct Light and Color Sensor
- Device running Vernier Graphical Analysis
Observe and Collect Data
Rather than recording data continuously over time, this experiment uses Graphical Analysis in Events with Entry mode—students collect a single illuminance reading at each distance they choose, entering the distance value by hand each time they keep a data point.
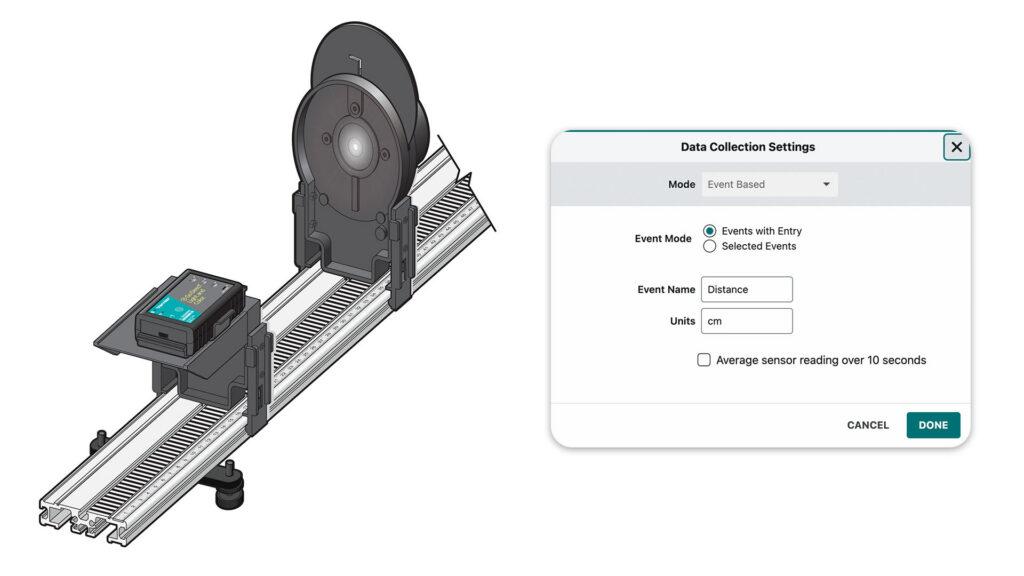
For this experiment setup, connect the Go Direct Light and Color Sensor in Graphical Analysis and update the Data Collection Settings to Event Based mode.
Students move the light sensor along the track from 10 cm to 20 cm in 1 cm increments, then continue out to 60 cm in larger steps, recording illuminance in lux at each position.
Evaluate and Analyze Data
When students examine their graphs of illuminance vs. distance, the curve drops off steeply at close range and levels out at larger distances—a shape that doesn’t match a simple inverse relationship. To find the best mathematical model, students use Apply Curve Fit in Graphical Analysis and select an inverse square function. The fit is strong, indicating that I=d2 is a good model for the relationship between illuminance and distance.
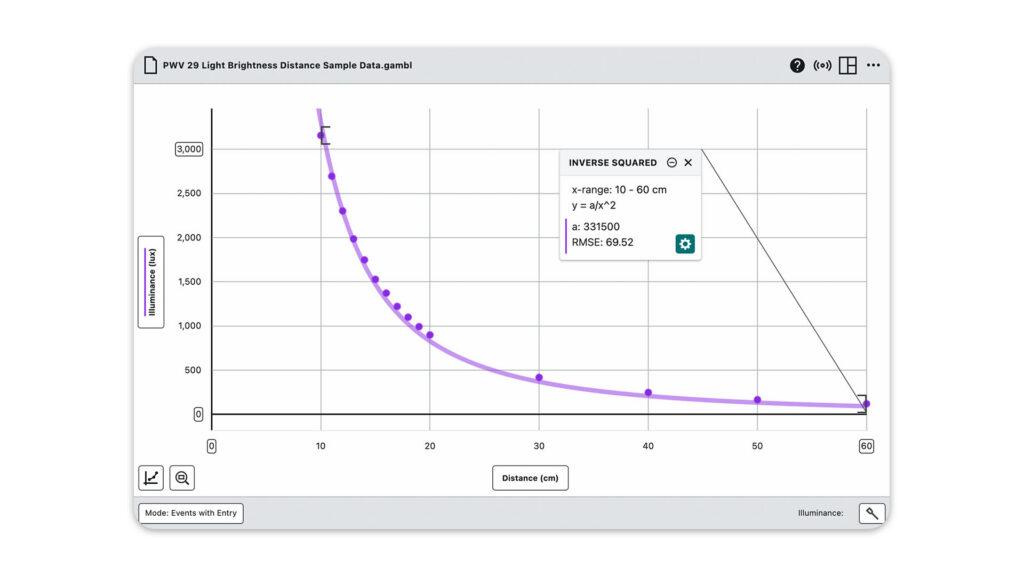
Students apply an inverse square curve fit in Graphical Analysis and compare the model to their experimental data.
Students can also linearize the data by adding a calculated column (see previous experiment) for 1/d² and plotting illuminance against it—producing a straight line through the origin that also indicates the inverse square relationship is a good model for the data.
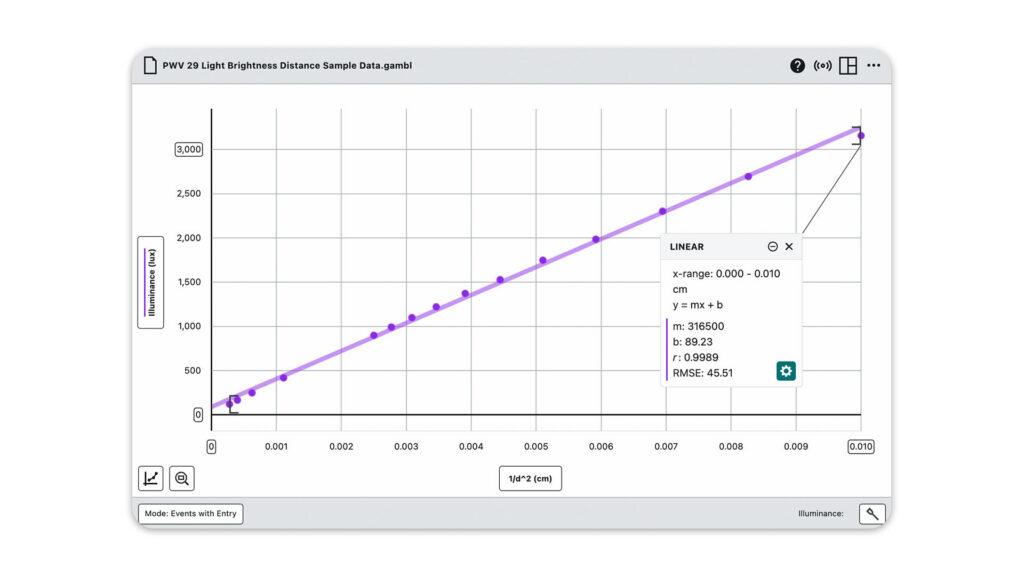
To linearize the graph, students add a calculated column for the reciprocal of distance squared, then plot illuminance against it.
How It Supports 3D Standards
This experiment addresses HS-PS4-1 and HS-PS3-1. Students apply the Science and Engineering Practices of Analyzing and Interpreting Data and Using Mathematics and Computational Thinking as they fit a mathematical model to their results. The inverse square relationship connects to the Crosscutting Concepts of Patterns and Cause and Effect.
Tips
- Other phenomena you can connect to this lab: how headlights on the road appear at different distances; how astronomers use light intensity to measure the distance to stars or to detect exoplanets; how medical physicists calculate X-ray dosing in radiation therapy; and how photographers apply different lighting techniques.
- The LED light source needs about 15 minutes to warm up before its brightness stabilizes. Use this time to have students make predictions about how they think brightness changes with distance.
- Darken the room as much as possible for best results. If a fully dark room isn’t available, take a background illuminance reading first and subtract it out using a Calculated Column in Graphical Analysis.
See These Labs in Action

Both experiments in this article are featured in our Reflect, Refract, Engage webinar, including live equipment demos and Graphical Analysis walkthroughs. Get sample data, student and instructor handouts, and other resources from the webinar here. Watch our full library of on-demand webinars on our YouTube channel.
Do you have creative ways of teaching optics with Vernier? Let us know at blog@vernier.com or share with us on social!
Questions? Reach out to physics@vernier.com, call 888-837-6437, or drop us a line in the live chat.
Share this Article
Related Articles


Sign up for our newsletter
Stay in the loop! Beyond Measure delivers monthly updates on the latest news, ideas, and STEM resources from Vernier.