Go Direct® Fluorescence/UV-VIS Spectrophotometer User Manual
Order Code: GDX-SPEC-FUV
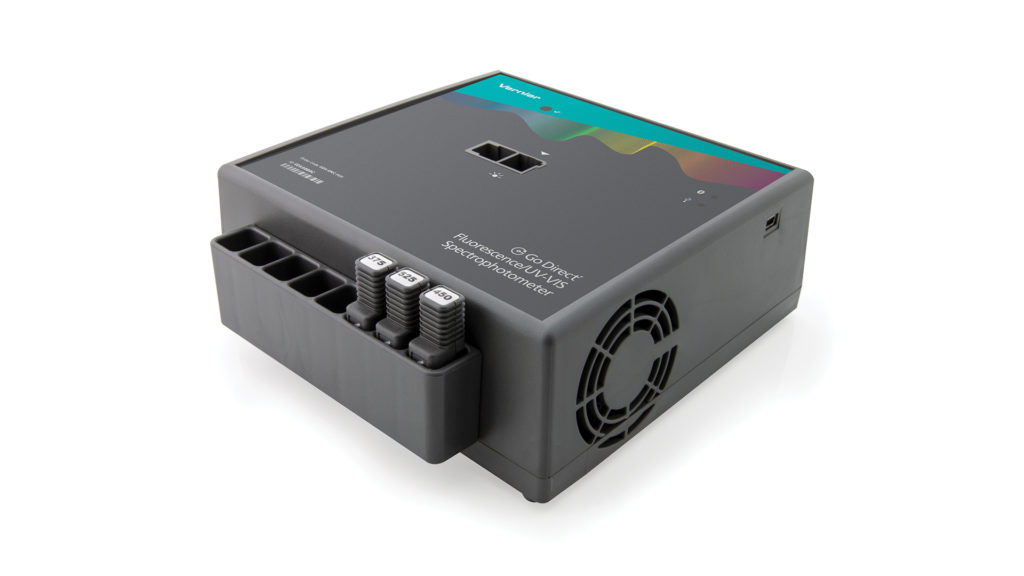
Go Direct Fluorescence/UV-VIS Spectrophotometer is a small, lightweight ultraviolet and visible light spectrofluorometer. It is a combined fluorometer with a UV-VIS absorbance spectrometer. Exchangeable LEDs ensure you get the exact excitation wavelength needed.
Note: Vernier products are designed for educational use. Our products are not designed nor are they recommended for any industrial, medical, or commercial process such as life support, patient diagnosis, control of a manufacturing process, or industrial testing of any kind.
What's Included
- Go Direct Fluorescence/UV-VIS Spectrophotometer
- AC Power Supply
- Fluorescence quartz cuvette
- Mini USB cable
- USB Power Adapter
- LED cartridges (3): 375 nm, 450 nm, 525 nm
Compatible Software and Interfaces
Choose a platform below to see its compatibility requirements.LabQuest
Interface LabQuest App LabQuest 3 Full support 1 LabQuest 2 Full support 1 LabQuest Incompatible Compatibility Notes
Computers
Software Interface Spectral Analysis Graphical Analysis Logger Pro (discontinued) No interface required Full support Incompatible Full support 1 LabQuest 3 Incompatible Full support 2 Incompatible LabQuest 2 Incompatible Full support 2 Incompatible Compatibility Notes
Chromebook
Software Interface Spectral Analysis (Web App) No interface required Full support iOS
Software Interface Spectral Analysis Graphical Analysis Graphical Analysis GW No interface required Full support Incompatible Incompatible LabQuest 3 Incompatible Full support 1 2 Full support 1 2 LabQuest 2 Incompatible Full support 1 2 Full support 1 2 Compatibility Notes
Android
Software Interface Spectral Analysis Graphical Analysis Graphical Analysis GW No interface required Full support Incompatible Incompatible LabQuest 3 Incompatible Full support 1 2 Full support 1 2 LabQuest 2 Incompatible Full support 1 2 Full support 1 2 Compatibility Notes
Quick Start: Vernier Spectral Analysis® and Bluetooth®
- Connect the AC Power Supply to the spectrophotometer. This supplies power to the lamp. Turn the power switch to the ON position. Wait for the lamp indicator LED to remain green.
- To power the Bluetooth® radio, connect the spectrometer to the USB power adapter or to a powered USB hub. The Bluetooth LED will blink. Note: Do not plug the USB into a computer USB port to run with Bluetooth wireless technology.
- Launch Spectral Analysis, then click Connect a Spectrometer.
- Select your sensor from the list. The sensor ID is located on the sensor label near the bar code. The Bluetooth LED on the sensor will now glow blue (no longer flashing).
- Click DONE. You are now ready to collect data.
Using other Vernier data-collection apps or connecting via USB?
Visit www.vernier.com/start-spectrometer
Note: This sensor also works with LabQuest 2 and LabQuest 3; it does not work with the original LabQuest.
Powering the Spectrometer
| Turning on the spectrometer | Connect to AC power. Turn the power switch on. Green LED indicator next to Power icon is solid when unit is ready to use. If indicator light turns red, disconnect all power, wait one full minute, and attempt again. |
| Turning off the spectrometer |
Turn the power switch to the off position. The lamp will turn off and the fan will continue to run to cool the electronics for several more minutes. Wait until this is complete before disconnecting AC power. |
Connecting the Spectrometer
See the following link for up-to-date connection information:
www.vernier.com/start/gdx-spec-fuv
Connecting via Bluetooth
| Ready to connect | Connect to AC power. Turn the power switch on. To power the Bluetooth radio, connect the spectrometer to the USB power adapter or to a powered USB hub. Blue LED next to Bluetooth icon flashes when sensor is ready to connect. |
| Connected | Blue LED next to Bluetooth icon is solid when sensor is connected via Bluetooth wireless technology. |
Connecting via USB
| Connected | LED next to Bluetooth icon is off. LED next to power is solid green. LED next to USB icon is solid green. |
Using the Product with Spectral Analysis
Connect the sensor following the steps in the Quick Start section of this user manual.
Select the Type of Data to Measure
The three options for Experiment Types are
- Measurement vs. Wavelength—collect a full spectrum.
- Measurement vs. Concentration—conduct a Beer's law experiment.
- Measurement vs. Time—collect time-based data for a kinetics experiment.
By default, Absorbance is expanded. You can also choose from % Transmittance, Fluorescence, Emissions, or Advanced Full Spectrum. Use the Advanced Full Spectrum mode to switch between all the measurement types in the same session. For complete instructions, refer to the Spectral Analysis user manual at www.vernier.com/sa
Measurement vs. Wavelength (Full Spectrum)
- Select Measurement vs. Wavelength.
- If applicable, follow instructions for calibration. Note: Calibration is not required for fluorescence or emissions.
- You are now ready to collect data. Fill a cuvette about 3/4 full of a sample of the solution to be tested. Place the sample in the Spectrophotometer and click or tap Collect. Click or tap Stop to end data collection. The spectrum is automatically stored.
- Save or export your data from the File menu.
Measurement vs. Concentration (Beer's law)
- Select Measurement vs. Concentration.
- If applicable, follow instructions for calibration. Note: Calibration is not required for fluorescence or emissions.
- Follow the instructions in the Choose a Wavelength dialog box. Select Done.
- Click or tap Collect. Your first sample should still be in the Spectrophotometer. After the reading stabilizes, click or tap Keep. Enter the concentration of the sample and click or tap Keep Point.
- Place your second sample in the cuvette slot. After the reading stabilizes, click or tap Keep. Enter the concentration of the sample and click or tap Keep Point.
- Repeat the previous step for the remaining samples. When finished, click or tap Stop to end data collection. The data are automatically stored.
- To see the best fit line equation for the standard solutions, click or tap Graph Tools, select Apply Curve Fit, and choose Linear. Click or tap Apply.
- If doing Beer's law to determine the concentration of an unknown, place the unknown sample in the cuvette holder. Click or tap Graph Tools and enable Interpolate. Click or tap along the line until you find the concentration value that matches your unknown's measurement.
- Save or export your data from the File menu.
Measurement vs. Time (Kinetics)
- Select Measurement vs. Time.
- If applicable, follow instructions for calibration. Note: Calibration is not required for fluorescence or emissions.
- Follow the instructions in the Choose a Wavelength dialog box. Select Done.
- The default data-collection settings collect measurements every two seconds until the user manually stops data collection.
- Mix the reactants. Transfer ~2 mL of the reaction mixture to a cuvette and place the cuvette in the spectrometer. Click or tap Collect.
- When finished, click or tap Stop.
- To fit a function to the data, click or tap Graph Tools, select Apply Curve Fit, and choose the appropriate curve fit. Click or tap Apply.
- To add a calculated column to the data set, click or tap Columns Options in the measurement header on the data table. Select Add Calculated Column. Modify the name, units, and displayed precision accordingly. Select Insert Expression and select the appropriate equation. Modify the parameters and column options, if necessary. Click or tap Apply. The calculated column is automatically displayed on the graph. To modify the data that are displayed on the graph, click or tap on the appropriate axis label.
- Save or export your data from the File menu.
Change the Settings in Spectral Analysis
- Click or tap the gear to show the Spectrometer Settings dialog.
- There are three parameters listed in the dialog box:
- Integration Time: This is similar to the shutter speed of a camera. Spectral Analysis automatically selects the proper sample time during calibration in Absorbance and % Transmittance modes. If using Fluorescence, Emissions, or Advanced Experiment modes, you can modify this value to increase the amount of light hitting the detector and the signal spectral output.
- Wavelength Smoothing: This is the number of adjacent readings on either side of a given value that is used to calculate an average value.
- Temporal Averaging: This is the number of readings taken at a given wavelength to calculate an average reading.
- Select the Calibrate button to recalibrate your spectrometer at any time.
Measure an Emission Spectrum with Spectral Analysis
You may use your Spectrophotometer to measure the visible emission spectrum of a light source such as an LED or a gas discharge tube. To do so, you will need to purchase the Vernier Optical Fiber (order code: VSP-FIBER).
Measure Intensity of Light Emissions
Insert the Vernier Optical Fiber into the spectrometer.
- Connect the spectrometer following the steps in the Quick Start section of this user manual.
- Open Spectral Analysis.
- Select the appropriate Emissions experiment from the listed options and follow the prompts in the app. Intensity is a relative measure with a range of 0–1. Note: The Spectrophotometer is not calibrated for measuring intensity.
- Aim the tip of the optical fiber at a light source. Start data collection. Click or tap the Stop button to end data collection.
If the spectrum maxes out (flat and wide peaks at a value of 1), increase the distance between the light source and the tip of the optical fiber cable or reduce the integration time (see the Change the Settings in Spectral Analysis section).
To adjust the integration time, click or tap the gear. Set the integration time to a suitable value.
Measure Fluorescence with Spectral Analysis
You may use your spectrophotometer to measure the fluorescence spectrum of an aqueous sample, such as chlorophyll, quinine, riboflavin, and fluorescein. Fluorescence is the emission of light by a compound after it has absorbed a particular wavelength of light. Under most circumstances, the emission of light after excitation will occur at a longer wavelength than the light used to excite it. The spectrometer comes with three LEDs (375 nm, 450 nm, and 525 nm) that serve as the excitation wavelengths. These were chosen specifically for common fluorescent compounds such as quinine, fluorescein, DAPI, and tryptophan. Additional LEDs can be purchased separately.
There are three general types of data collection that measure fluorescence— fluorescence vs. wavelength, which produces a spectrum, fluorescence vs. concentration, and fluorescence vs. time for kinetics experiments. To collect these types of data after the experiment type has been selected as Fluorescence, follow the instructions in the Spectral Analysis user manual at www.vernier.com/spectral-analysis. Note: You may need to change the integration time to get accurate peak intensities in fluorescence mode. To adjust the integration time click or tap on the gear. Set the integration time to a suitable value. Temporal averaging is another important value to adjust to get stronger peak intensities.
These are some additional features in fluorescence mode that may improve your data quality:
- Adjust the LED brightness.
- Click or tap on the gear to adjust the LED intensity.
- Adjust the LED intensity between 0% and 100%. A setting of 0% turns the LED off, while a setting of 100% is the maximum LED intensity. Note: The LED intensity is set to 50% by default.
Note: If you adjust this value during data collection, you may want to recalibrate or perform a manual baseline adjustment with a calculated column.
- Set the excitation wavelength.
- Click or tap on the gear to set the excitation wavelength so it appears correctly in column headers and graph axes.
Note: The default excitation wavelength is 375 nm. The app cannot automatically detect the wavelength of the LED you are using. Be sure to update the value from the drop down list to match your LED.
Using the Spectrophotometer with LabQuest 2 or LabQuest 3
Select the Type of Data (or Units) You Want to Measure
There are three general types of data collection that measure absorbance or transmittance—absorbance (or %T) vs. wavelength, which produces a spectrum, absorbance (or %T) vs. concentration for Beer’s law experiments, and absorbance (or %T) vs. time for kinetics experiments.
The default data type is absorbance. If you want to measure the absorbance of a solution, proceed directly to the Calibrate section.
If you want to measure %T, fluorescence, or intensity, do the following:
- From the Sensors menu, choose Change Units ► USB: Spectrophotometer.
- Select the unit or data type you wish to measure.
Calibrate the Spectrophotometer (Not Required if Measuring Intensity or Fluorescence)
- Choose Calibrate ► USB: Spectrophotometer from the Sensors menu. Note: For best results, allow the Spectrophotometer to warm up for a minimum of five minutes.
- Fill a cuvette about 3/4 full with distilled water (or the solvent being used in the experiment) to serve as the blank. After the Spectrophotometer has warmed up, place the blank cuvette in the Spectrophotometer.
- Follow the instructions in the dialog box to complete the calibration, and then tap OK.
Collect Data with LabQuest
Measurement vs. Wavelength (Generate a Spectrum)
- Fill a cuvette about 3/4 full of the solution to be tested and place it in the Spectrophotometer.
- Start data collection by tapping on the Start button in the lower left corner of the screen. Tap the Stop button to end data collection.
- Select wavelength. Note: The wavelength of maximum absorbance (λ max) selected will be used for any subsequent data collection, such as a Beer’s law experiment (abs vs. conc.) or a kinetics experiment (abs vs. time). You can tap on the graph to select a wavelength. Another way to change the wavelength is to navigate to the Meter screen, tap on the meter, and select Change Wavelength. Enter the wavelength of your choice and select OK. If the wavelength you type in is not measured by the unit, LabQuest will automatically choose the wavelength closest to your choice.
- To store the spectrum data, tap on the file cabinet icon in the upper right of your screen.
Measurement vs. Concentration (Beer’s Law Studies)
- Generate a spectrum as described above. On the Meter screen, tap Mode. Change the mode to Events with Entry.
- Enter the Name (e.g., Concentration) and Units (e.g., mol/L). Select OK.
- A message will appear warning you to either save or discard the full spectrum run. Make your choice and proceed with data collection.
- Place your first Beer’s law standard solution in the Spectrophotometer. Start data collection. After the absorbance reading stabilizes, tap Keep. Enter the concentration of the solution and select OK.
- Place your second standard sample in the Spectrophotometer. After the absorbance readings stabilize, tap Keep. Enter the concentration of the second sample and select OK.
- Repeat Step 5 for the remaining standard samples. After you have tested the final standard, tap the Stop button to end data collection.
- To calculate a best fit line equation for your standards, choose Curve Fit from the Analyze menu. Select Linear for the Fit Equation, and then select OK. The graph screen will appear again with the linear regression equation displayed.
- Place a cuvette containing an unknown sample of solution in the Spectrophotometer. Tap the Meter tab and write down the displayed absorbance value. Tap the Graph tab and choose Interpolate from the Analyze menu. Trace the linear regression equation to determine the concentration of the unknown.
Measurement vs. Time (Kinetics)
- Generate a spectrum as described above. On the Meter screen, tap Mode. Change the data-collection mode to Time Based.
- You can change the rate, interval, and/or duration of time of data collection, if desired. Select OK when you are ready to proceed.
- A message will appear warning you to either save or discard the full spectrum run. Make your choice and proceed with data collection.
- Mix the reactants, transfer ~2 mL of the reaction mixture to a cuvette and place the cuvette in the Spectrophotometer. Start data collection. You may tap the Stop button to end data collection early.
- To calculate a function for your data, choose Curve Fit from the Analyze menu. Select the Fit Equation, and then select OK. The graph screen will appear again.
Measure Fluorescence with LabQuest
You may use your Spectrophotometer to measure the fluorescence spectrum of an aqueous sample, such as chlorophyll, quinine, and fluorescein. Fluorescence is the emission of light by a compound after it has absorbed a particular wavelength of light. Under most circumstances, the emission of light will occur at a longer wavelength than the light used to excite it. The spectrometer comes with three LEDs (375 nm, 450 nm, and 525 nm) that serve as the excitation wavelengths. Additional excitation LEDs can be purchased separately.
There are three general types of data collection that measure fluorescence— fluorescence vs. wavelength, which produces a spectrum, fluorescence vs. concentration, and fluorescence vs. time for kinetics experiments. Once the units have been changed to Fluorescence from the Experiment menu, follow the instructions in the section titled Collect Data with LabQuest to collect these types of data.
These are some additional features in fluorescence mode that may improve your data quality:
Adjusting the LED Brightness
- To set the LED intensity, tap on the red meter and select Set LED.
- The LED Intensity is set to 50 by default. Adjust it between 0 and 100. A setting of 0 turns the LED off while a setting of 100 is the maximum LED intensity. Note: If you adjust this value during data collection, you may want to recalibrate or perform a manual baseline adjustment with a calculated column.
Adjusting the Sample Time
- On the Meter screen, tap Mode to set the Sample Time.
- By default, this value is set to 100 ms. The Sample Time is the amount of time the detector is exposed to the emission light. The longer the sample time, the greater the signal, and the longer the time it takes to collect data. 100 ms is a good starting point for data collection. You may adjust this value while data collection is active. If you do this, the spectrum will update in real time. Note: If you adjust this value during data collection, you may want to recalibrate or perform a manual baseline adjustment with a calculated column.
Calibrate Fluorescence
- Fill a cuvette about 3/4 full with distilled water (or the solvent being used in the experiment) to serve as the blank.
- To calibrate the spectrophotometer, choose Calibrate ► Spectrometer from the Sensors menu.
- Follow the instructions in the dialog box to complete the calibration, and then click
 .
.
Measure an Emission Spectrum with LabQuest
You may use your Spectrophotometer to measure the visible emission spectrum of a light source such as an LED or a gas discharge tube. To do so, you will need to purchase an optical fiber assembly (order code: VSP-FIBER).
Measure Intensity of Light Emissions
- Insert the Spectrophotometer Optical Fiber into the Fluorescence/UV-VIS Spectrophotometer.
- Aim the tip of the optical fiber at a light source. Start data collection. Tap the Stop button to end data collection. Note: The Spectrophotometer is not calibrated for measuring intensity.
If the spectrum maxes out (flat and wide peaks at a value of 1), increase the distance between the light source and the tip of the optical fiber cable or reduce the sample time (see Change the Settings in LabQuest below).
To increase the sample time, or if data collection is unusually slow, choose Set Up Sensors ► Spectrophotometer: 1 from the Experiment menu. Set the Sample Time (begin with 75 ms, with subsequent reductions by 20 ms) to a suitable value and decrease the Samples to Average to 1.
Change the Settings in LabQuest
The Data Collection Screen in LabQuest lists all the settings for the device. To display this box choose Sensors ► Data Collection from the Meter screen.
For most experiments, the default settings work well.
There are five parameters listed in the dialog box.
- Sample Time: This is similar to the shutter speed of a camera. LabQuest automatically selects the proper sample time during calibration. Note: For emission studies, you may need to change the sample time manually.
- Wavelength Smoothing: This is the number of adjacent readings on either side of a given value that is used to calculate an average value. Note: Be careful adjusting this parameter as it may shift your wavelength values slightly.
- Samples to Average: This is the number of readings taken at a given wavelength to calculate an average reading.
- Wavelength Range: The range is determined by the type of Spectrophotometer in use.
- LED Intensity: This allows you to change the intensity of the excitation LED. This setting is only available in fluorescence mode by tapping on the meter.
Specifications
|
Detection modes |
Absorbance, Fluorescence, % Transmittance, Intensity (fiber required), and Raw Lamp |
|
Experiment types |
Full Spectrum, time-based (kinetics), and event-based (Beer's Law) |
|
Dimensions |
18.5 cm × 17 cm × 7 cm |
|
Lamp power supply |
AC adapter (included) |
|
Bluetooth power supply |
USB (USB adapter included) |
|
Power consumption |
3 A start-up, 500 mA continuous |
|
Absorbance light source |
Deuterium (UV) and Incandescent (VIS) |
|
Emission light source |
Exchangeable LED included (ships with 375 nm, 450 nm, 525 nm) |
|
Detector |
Linear CCD |
|
Wavelength range |
220 nm–850 nm |
|
Wavelength reporting interval |
~1 nm |
|
Optical resolution |
3.0 nm (as determined with 486 nm hydrogen emission spectral line FWHM) |
|
Wavelength accuracy |
± 2.0 nm (as determined with holmium oxide NIST standard) |
|
Absorbance photometric accuracy |
± 5.0% (as determined with potassium dichromate NIST standards) |
|
Absorbance photometric range (for best accuracy) |
0.1–1.0 |
|
Typical scan time |
~2 s |
|
Sample format |
10 mm × 10 mm cuvette (UV fluorescence cuvette included) |
|
Fluorescence emission detection limit |
1 mg/L quinine sulfate dihydrate in 0.1 M H2SO4 |
|
Beam height (z dimension) |
8.5 mm |
Safety
- Always wear UV blocking safety glasses or goggles when using this device. The light source emits ultraviolet radiation and can cause eye damage.
- When this instrument is in data-collection mode labeled Intensity, the light source will be blocked or turned off. Continue to use proper safety precautions.
- This instrument contains an internal high-voltage power source. Position the instrument where the ON/OFF switch can be easily reached. Do not move the instrument when it is running. Do not attempt to open or remove the case at any time.
- Do not remove or modify any of the installed safety components of this device. Doing so will create an unsafe operating condition and will void the product warranty.
- No user-serviceable parts are in this device. Do not attempt to open or modify this device. Contact Vernier for all repairs and service including lamp replacement.
- Handle the device with care. This instrument can be damaged if it is dropped.
- Do not use this instrument if it is damaged in any way. Contact Vernier Technical Support for troubleshooting and technical assistance.
- Do not use this instrument for clinical or diagnostic procedures.
Troubleshooting
- If you plan on only taking fluorescence data, the power cable does not need to be attached, nor does the power switch need to be on. This will help save your deuterium lamp for absorbance measurements.
- In fluorescence measurements, the inner-filter effect is always a consideration. The inner filter effect results in an apparent decrease in emission quantum yield and/or distortion of bandshape as a result of reabsorption of emitted radiation. To avoid this, it is best to perform fluorescence measurements on samples that have an absorbance below 0.1.
Find troubleshooting tips here: www.vernier.com/til/3918
Repair Information
- The UV light source in the Go Direct Fluorescence/UV-VIS Spectrophotometer is a deuterium lamp. The lifetime of this source is rated at approximately 1000 hours. Lifetime is defined as the amount of time it takes the lamp to decrease to 50% of its original output. Deuterium lamp life is also inversely proportional to the number of ignitions, so it is best to limit the number of times you ignite the bulb if you wish to prolong its life.
- The deuterium lamp is covered by a one-year warranty or 1000 hours, whichever comes first.
- Contact Vernier for all repairs and service including lamp replacement.
- No user-serviceable parts are in this device. Do not attempt to open the case of the device. Do not attempt to change or repair the lamp. Doing so will create an unsafe operating condition and will void the product warranty.
If you have watched the related product video(s), followed the troubleshooting steps, and are still having trouble with your Go Direct Fluorescence/UV-VIS Spectrophotometer, contact Vernier Technical Support at support@vernier.com or call 888-837-6437. Support specialists will work with you to determine if the unit needs to be sent in for repair. At that time, a Return Merchandise Authorization (RMA) number will be issued and instructions will be communicated on how to return the unit for repair.
Accessories/ Replacements
| Item | Order Code |
|---|---|
|
CUV-QUARTZ-FUV |
|
|
VSP-FIBER |
|
|
CB-USB-MINI |
|
| Replacement Power Supply for Ultraviolet Range (UV-VIS) Spectrophotometers |
VSP-UV-PS |
Warranty
Warranty information for this product can be found on the Support tab at www.vernier.com/gdx-spec-fuv/#support
General warranty information can be found at www.vernier.com/warranty
Contact Support
Fill out our online support form or call us toll-free at 1-888-837-6437.