Attention: Safety Recall of Vernier Go Direct Charge Station. Click to learn more.

Shop

Vernier Instrumental Analysis Support

Software Update

Download the latest update to Instrumental Analysis for enhancements, bug fixes, and new features.

  • Windows
  • Mac

User Manual

Download our full user manual for an overview and instructions on the features in Instrumental Analysis.

Sample Experiment Downloads

Separation of Toluene and Cyclohexane
Detection of Chemical Isomers with Gas Chromatography
Distillation of Banana Oil
Exploring RuHex and Sweep Rate in Quantitative Cyclic Voltammetry
Measuring Acetaminophen Using Cyclic Voltammetry
Exploring Natural Products with Polarimetry
Food Chemistry: Inversion Reaction of Sucrose and Invertase Enzyme

Screencasts

Select a Region

Select a region for data analysis.

  1. Click or tap and drag across the graph to select a region.
  2. If needed, drag the boundary lines to resize the region.

Apply a Curve Fit to a Selected Region

Analyze a selection of your data.

  1. Select a region.
  2. Click or tap the Graph Tools button.
  3. Select a curve fit model.
  4. Click or tap somewhere outside the selection tool or tap Apply to view the equation.

Calculate Statistics

Find the mean, standard deviation, minimum, and maximum values of the data.

  1. Click or tap the Graph Tools button.
  2. Select Statistics.
  3. If needed, scroll the text in the Statistics dialog to view all of the information.

Note: You can also calculate statistics for a portion of the data by first selecting a region.

Plot Data from Multiple Data Sets

Add or remove the columns of data plotted on any graph.

  1. Click or tap the y-axis label to display the selection popover.
  2. Click or tap a column to add or remove it from the graph.
  3. Click or tap off of the popover to dismiss the tool.

Add Peak Integral for Gas Chromatography Experiments

  1. Select a region.
  2. Click or tap the Add Peak Integral button.
  3.  If needed, drag the boundary lines to resize the integrated peak selection. 

Note: You can modify the name of the peak as desired. This feature is only available if you have a Vernier gas chromatograph connected. 

Supported Instrumentation

The concept of chirality can be difficult for students to visualize. Go Direct® Polarimeter provides a visual representation of this concept by measuring the optical rotation of optical isomers such as sugars, amino acids, and proteins. 

Teach students chromatography with an affordable, portable gas chromatograph that detects polar and nonpolar compounds. With the easy-to-use Go Direct Mini GC™, students can separate, analyze, and identify substances contained in a volatile liquid or gaseous sample. 

Give your students hands-on experience with electrochemical reactions using this affordable potentiostat, the Go Direct Cyclic Voltammetry System, and disposable screen-printed electrodes. 

About Instrumental Analysis

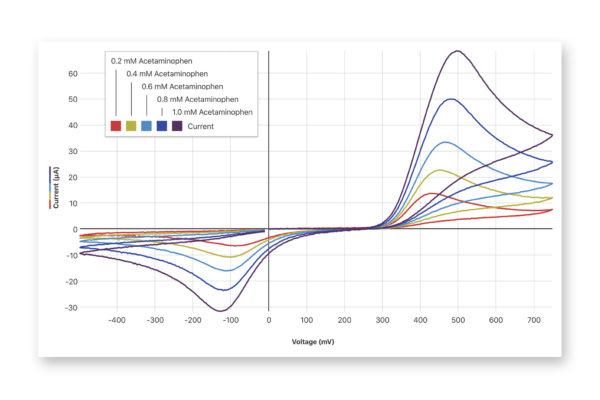
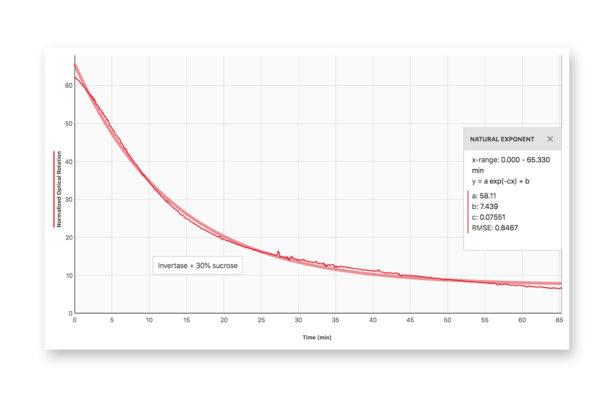
With our free Vernier Instrumental Analysis™ app, students can collect and analyze data from our Go Direct® Mini GC, Go Direct Polarimeter, and Go Direct Cyclic Voltammetry System using computers, Chromebooks, or other mobile devices. Learn more about Instrumental Analysis »

Contact Vernier Support

Need more assistance? Fill out our online support form or call us toll-free at 1-888-837-6437.

SAVE/SHARE YOUR CART