Ocean Optics Absorbance and Emission Spectrometers (discontinued)
Ocean Optics spectrometers are not compatible with Spectral Analysis.


Troubleshooting
- Primary Test: Are you using Logger Pro 3.6 (or newer)?
- Secondary Test: Is the USB cable securely connected?
Refer to your sensor’s Specifications and User Guide for general usage information.
Additional Troubleshooting
GENERAL
- Can Logger Pro or LabQuest be used to collect data from spectrophotometers?
- How do I separate the light source from the detector of an Ocean Optics spectrometer?
- How do I connect a fiber optic cable to an Ocean Optics spectrometer?
- What is the difference between the types of cuvettes you sell for colorimeters and spectrophotometers?
- Does the Vernier Spectrophotometer Optical Fiber work with any of the Ocean Optics Spectrometers or vice versa?
- Do you sell replacement lids for your plastic cuvettes?
- How do I check the lamp output of my spectrometer?
- Do you accept donations of old spectrometers?
- Why don't all of my spectrometers and/or colorimeters read the same absorbance value for the same sample?
- What types of liquids can be poured into your plastic colorimeter or spectrophotometer cuvettes without harming the cuvette?
- Where can I get quartz cuvettes for your spectrophotometers?
- Why don't the absorbance readings for the colorimeters and spectrometers have units?
- What is the cost of repairs for an Ocean Insight (formerly Ocean Optics) spectrometer?
SOFTWARE ISSUES
- Why is the maximum sample time for a spectrometer set at 1000 milliseconds?
- Does Logger Pro support Ocean Optics Spectrometers on a 64-bit Windows system?
- Why are there blank data table cells in my spectrometer absorbance data?
- Spectrometer Error: 'Could Not Collect Values' or 'Calibration Failed'
- My Spectrometer is not working properly. It won't calibrate or is giving very noisy data.
- How can I overlay two emission spectra graphs in Logger Pro?
- How can I display both Absorbance and % Transmittance, from Spectrometer measurements, in Logger Pro 3?
- I collected Absorbance data and then Fluorescence data (or emission data) with my spectrometer. I am now collecting Absorbance data again and my data does not look correct.
- Is there a way to toggle on/off the colored background behind the absorbance spectrum graph?
- Ocean Optics spectrometers fail to connect to a computer running Logger Pro for Windows (Windows 8,8.1,or 10).
EXPERIMENTS
- Do you have labs written for your spectrophotometers?
- Can I do blackbody experiments with your Spectrometers?
- Do you have a spectrometer that can measure DNA concentration and purity?
- Can I use my spectrometer to collect data at one wavelength (Beer's law or kinetics)?
- How do I get an A260/A280 value with your UV-VIS spectrometers in Logger Pro?
- Why is the absorbance reading on my device (spectrometer/colorimeter) unstable or nonlinear at values above 1.0?
- Can I have my spectrometer capture full wavelength spectra episodically?
- Do you have instructions on how to use a spectrophotometer to conduct the Photosynthesis lab?
- Why can't I see better Hydrogen emission lines with my spectrometer?
Specifications
Specs are different for each spectrometer. See your spectrometer’s Specifications and User Guide for more information.
- Light Source
⚬ Vernier Spectrometer: Tungsten and violet LED
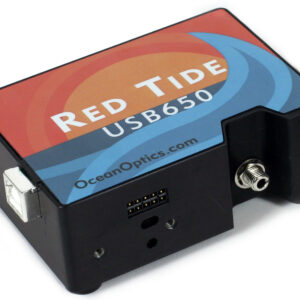
⚬ Red Tide VIS Spectrometer: Tungsten and violet LED
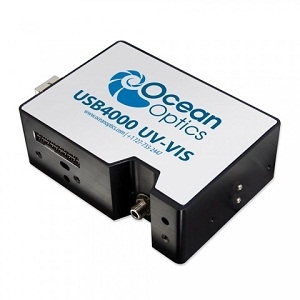
⚬ Red Tide UV-VIS Spectrometer: Tungsten (VIS) and deuterium (UV)
⚬ Red Tide Emissions Spectrometer: None - Detector: Linear CCD
- Wavelength Range:
⚬ Vernier Spectrometer: 380 to 950 nm
⚬ Red Tide VIS Spectrometer: 380 to 950 nm
⚬ Red Tide UV-VIS Spectrometer: 220 to 850 nm
⚬ Red Tide Emissions Spectrometer: 380 to 950 nm - Wavelength Reporting Interval
⚬ Vernier Spectrometer: 2 nm
⚬ Red Tide VIS Spectrometer: 1 nm
⚬ Red Tide UV-VIS Spectrometer: 1 nm
⚬ Red Tide Emissions Spectrometer: 1 nm - Optical Resolution: 3.0 nm
(as determined by the full width of half maximum of designated hydrogen emission peak) - Wavelength Accuracy (as determined with holmium oxide NIST standard)
⚬ Vernier Spectrometer: ±2 nm
⚬ Red Tide VIS Spectrometer: ±2 nm
⚬ Red Tide UV-VIS Spectrometer: ±1.5 nm
⚬ Red Tide Emissions Spectrometer: ±2 nm - Photometric Accuracy: (as determined with nickel sulfate standards between 0.1–1.0 AU)
⚬ Vernier Spectrometer: ±5.0 %
⚬ Red Tide VIS Spectrometer: ±5.0 %
⚬ Red Tide UV-VIS Spectrometer: ±4.0 % - Typical Scan Time: ~2 s
- Operating Temperature: 15 to 35ºC
- Dimensions
⚬ Vernier Spectrometer: 10 cm × 8.7 cm × 3 cm
⚬ Red Tide VIS Spectrometer: 10 cm × 8.7 cm × 3 cm
⚬ Red Tide UV-VIS Spectrometer: 14.2 cm × 8.7 cm × 3.0 cm
⚬ Red Tide Emissions Spectrometer: 6.3 cm × 8.7 cm × 3 cm - Power
⚬ Vernier Spectrometer: from computer via USB cable
⚬ Red Tide VIS Spectrometer: from computer via USB cable
⚬ Red Tide UV-VIS Spectrometer: AC adapter
⚬ Red Tide Emissions Spectrometer: from computer via USB cable
Calibration
Calibrate this sensor? Yes, in absorbance mode. Calibration when using Emission mode unnecessary. See calibration instructions below:
- Start the calibration.
⚬ Logger Pro: Choose Calibrate ▶ Spectrophotometer from the Experiment menu.
⚬ LabQuest App: Choose Calibrate ▶ USB: Spectrophotometer from the Sensors menu.
Note: For best results, allow the Spectrophotometer to warm up for a minimum of five minutes. - Fill a cuvette about 3/4 full with distilled water (or the solvent being used in the experiment) to serve as the blank. After the spectrophotometer has warmed up, place the blank cuvette in the spectrophotometer. Align the cuvette so a clear side of the cuvette is facing the light source.
- Follow the instructions in the dialog box to complete the calibration, and then tap OK.
Related Products
- Vernier UV-VIS Spectrophotometer (
VSP-UV ) - Plastic Cuvettes (Visible Range) (
CUV ) - Plastic Cuvettes (UV-VIS) (
CUV-UV ) - Go Direct® SpectroVis® Plus Spectrophotometer (
GDX-SVISPL )
Other Ocean Optics Spectrometers that work with Logger Pro and LabQuest App