Sharing ideas and inspiration for engagement, inclusion, and excellence in STEM
What makes forensic science such a compelling way to teach chemistry? Whether or not students are fans of crime shows like CSI, NCIS, or Bones, using storytelling to frame investigations helps transform abstract concepts into engaging, high-stakes problem solving. Students aren’t just running a reaction in a cuvette—they’re solving a mystery. And to make their case, they must analyze evidence, interpret data, and communicate their findings like forensic scientists.
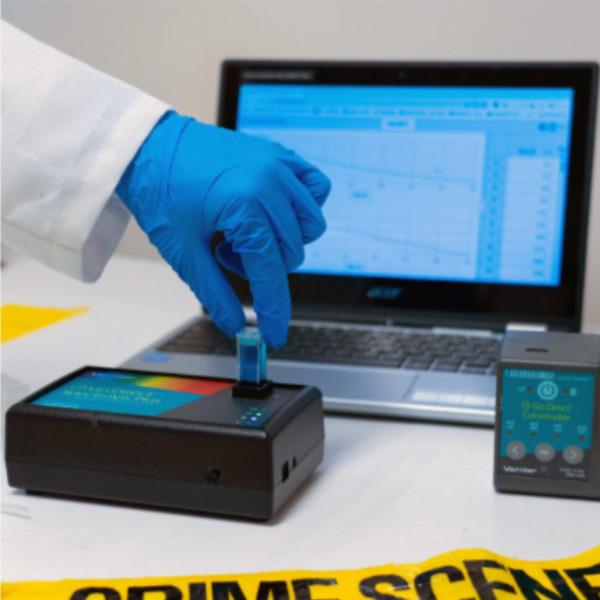
In this hands-on experiment, students use the Go Direct® SpectroVis® Plus Spectrophotometer to explore how concentration, absorbance, and reaction rates are connected as they investigate whether a food dye and bleach mixture could act as a timer on a suspected bomb. By determining the reaction order and half-life, students uncover and explain how this chemical process could be used in a forensic scenario.
Color Countdown Timer (Spectrophotometer)
Experiment #7A from Forensic Chemistry Experiments
When investigators discovered a suspicious backpack at an airport terminal, they found containers containing a blue solution and a colorless solution rigged to mix. Could this seemingly harmless mixture have been used as a timer for something more sinister?
The Chemistry Behind the Case
When food dye is mixed with bleach, the dye undergoes a chemical reaction, losing its color over time. This reaction follows the general equation:
FoodDye + OCl⁻ → Colorless Molecule
The kinetics, or reaction speed, depends on the concentration of the reactants and temperature. Since the bleach is present in a much higher concentration than the dye, its concentration stays nearly constant, allowing students to focus on how the food dye concentration affects the reaction rate:
Rate = k[FoodDye]x
By collecting and analyzing data, students determine the value of the exponent, x, on [FoodDye] to establish the reaction order. Note that the rate of reaction of food color with bleach is different depending on color—we’re using blue dye in this experiment. If students test other dyes, they may need to adjust the bleach concentration.
What You’ll Need
- Go Direct SpectroVis Plus Spectrophotometer
- Device with Vernier Spectral Analysis®
- (2) cuvettes and caps
- Cuvette rack
- 100 mL beaker
- (2) 10 mL graduated cylinders
- (2) Beral pipettes
- Blue food dye solution
- Diluted bleach solution (NaClO)
- Distilled water
- Tissues (lint-free)
What Students Will Do
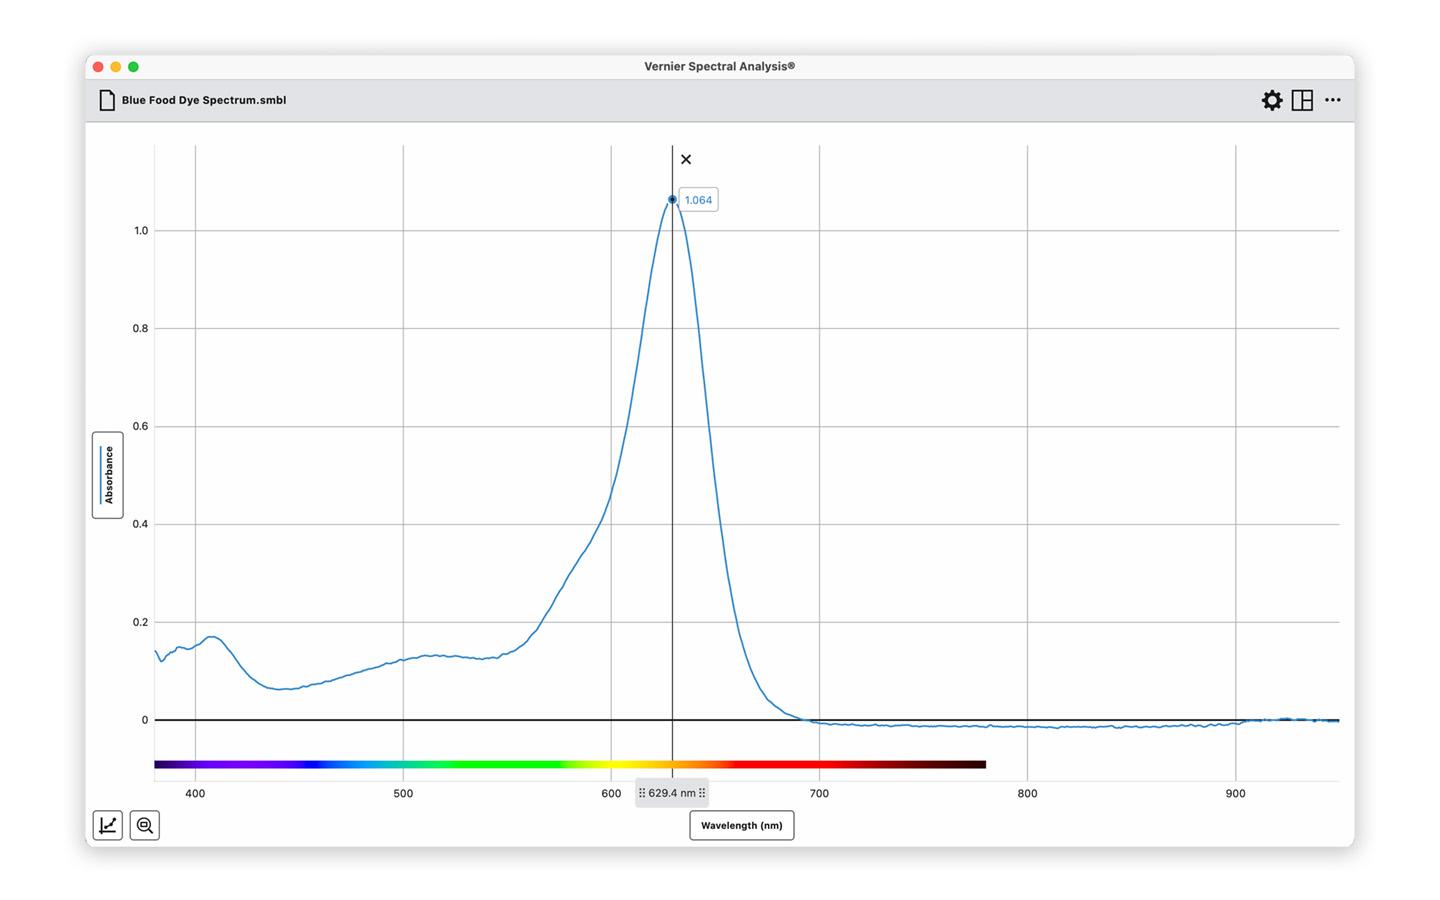
In the first part of this experiment, students identify the wavelength of maximum absorbance, λmax.
- Launch the Spectral Analysis app and connect the spectrophotometer.
- Click or tap Absorbance vs. Time (Kinetics).
- Calibrate the device using a blank cuvette filled with distilled water.
- Prepare a cuvette with a diluted blue food dye solution.
- Run a full absorbance spectrum scan to identify the λmax, the wavelength where the dye absorbs the most light.
Next, students track the reaction kinetics. This step should be done with advanced preparation and completed quickly.
- Combine 10 mL of food dye and 10 mL of dilute bleach in a 100 mL beaker and swirl.
- Fill a clean cuvette about ¾ full and place it in the spectrophotometer.
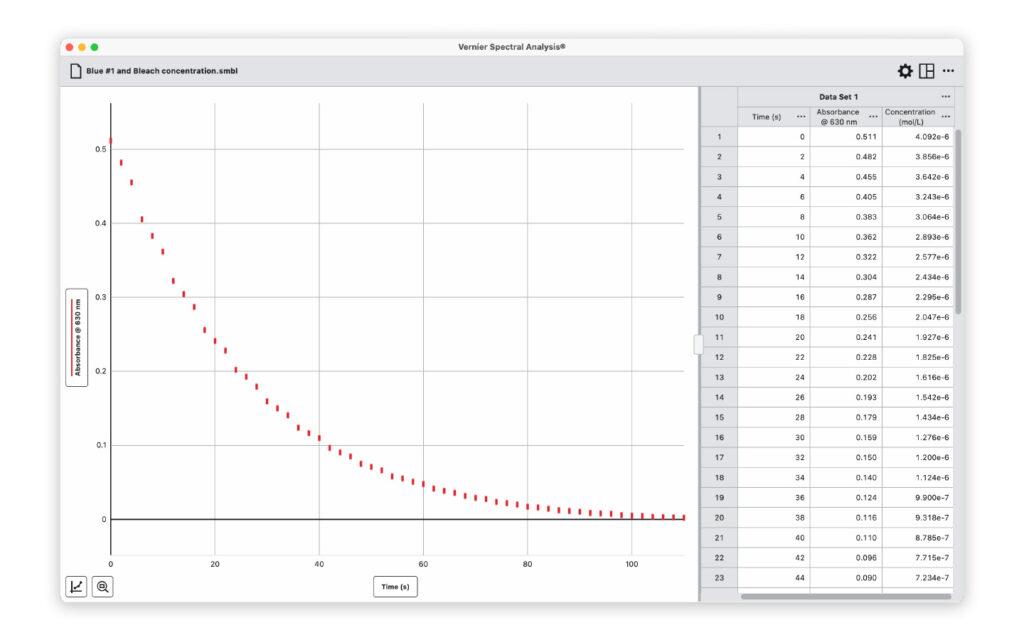
- Start data collection and observe how the absorbance decreases as the dye color fades over time (about 200 seconds).
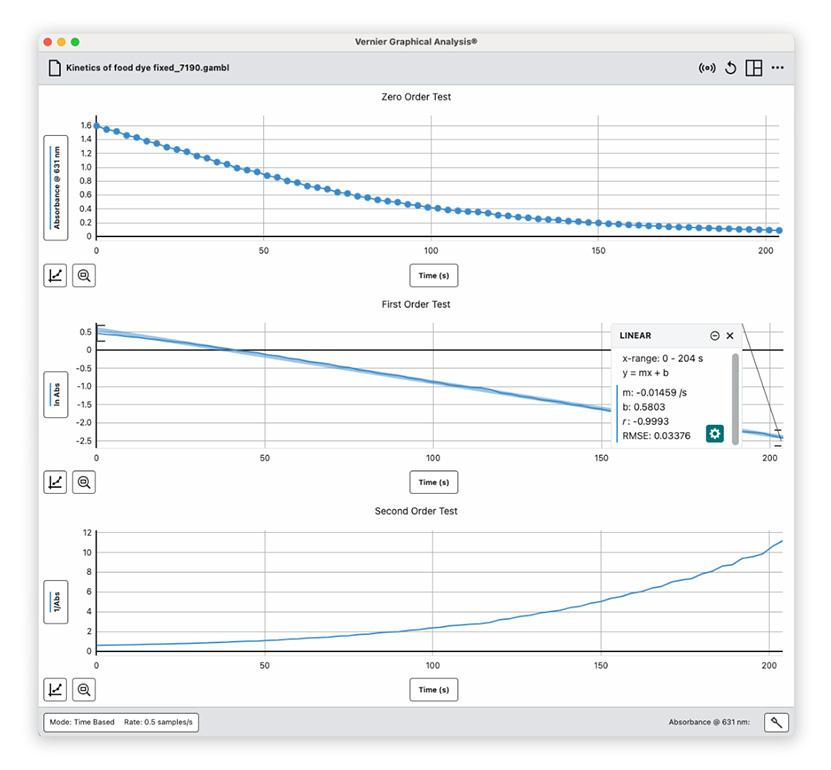
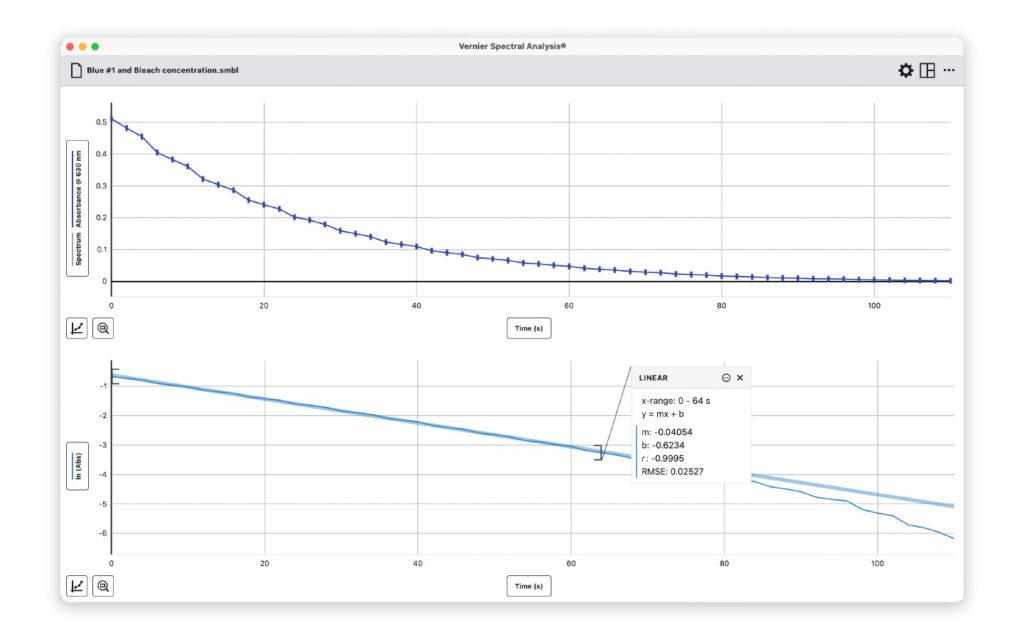
Now, students can analyze the data and graphs to decide if the reaction is zero, first, or second order with respect to food dye. This can be done using calculated columns in Spectral Analysis.
- Plot Absorbance vs. Time (tests for zero-order kinetics).
- Plot ln (Absorbance) vs. Time (tests for first-order kinetics).
- Plot 1/Absorbance vs. Time (tests for second-order kinetics).
Lastly, students identify the half-life or t½. Since the timer in the scenario actuates when the reaction reaches its half-life, students will determine when this occurs using one of two methods:
- Use the Graph: Identify when absorbance drops to half its initial value.
- Use the Equation: For a more accurate determination of half-life, students can use the equation: t½ = ln(2) / k
Now students can determine at what point the absorbance would have dropped to trigger the hypothetical timer in the forensic scenario.
How It Supports 3D Standards
This investigation engages students in sensemaking and data analysis as they examine how molecular interactions influence reaction rates and energy changes. They also see firsthand how some technologies play a role in forensic investigations, as spectroscopy provides a critical tool for analyzing unknown substances. Students use mathematics and computational thinking to construct explanations, evaluate, and communicate information.
Tips
- This experiment can also be done with a Go Direct Colorimeter.
- Dilute samples properly to stay within the spectrophotometer’s optimal linear range (0–1 absorbance).
- Select simple store-bought bleach with sodium hypochlorite (NaOCl) as the first ingredient. Avoid varieties with added detergents.
Want to see this experiment in action? Check out our recent webinar to get more step-by-step instruction and tips from our expert chemistry team.
Do you have innovative ways of teaching kinetics with Vernier? Let us know at blog@vernier.com or share with us on social! Questions? Reach out to chemistry@vernier.com, call 888-837-6437, or drop us a line in the live chat.
Share this Article
Related Articles


Sign up for our newsletter
Stay in the loop! Beyond Measure delivers monthly updates on the latest news, ideas, and STEM resources from Vernier.