Sharing ideas and inspiration for engagement, inclusion, and excellence in STEM
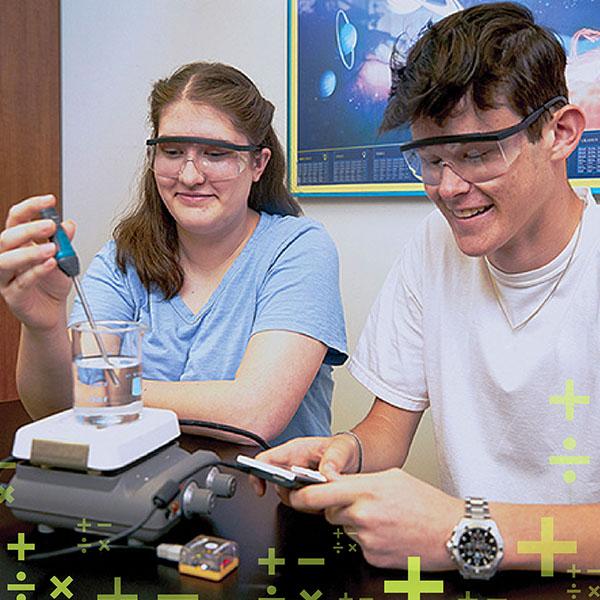
Looking for ways to make math more accessible to your students? Help them build confidence in math and science concepts by using real-time data collection! When students are tasked with exploring real-world phenomena, math transforms from an abstract, intimidating concept into a practical tool that students can use to develop and articulate answers to questions like, “Why are headlights on a car dimmer at a distance?” or “Why do I feel warmer wearing a black shirt on a sunny day?”
With enhanced compatibility between Vernier and Texas Instruments, students can now explore math in tangible, real-world scenarios by wirelessly capturing and analyzing real-time data on their TI-Nspire™ CX II graphing calculators. By integrating math and science, educators can enrich student comprehension, deepen their understanding of the natural world, and prepare students for careers in STEM.
What’s New with TI and Vernier
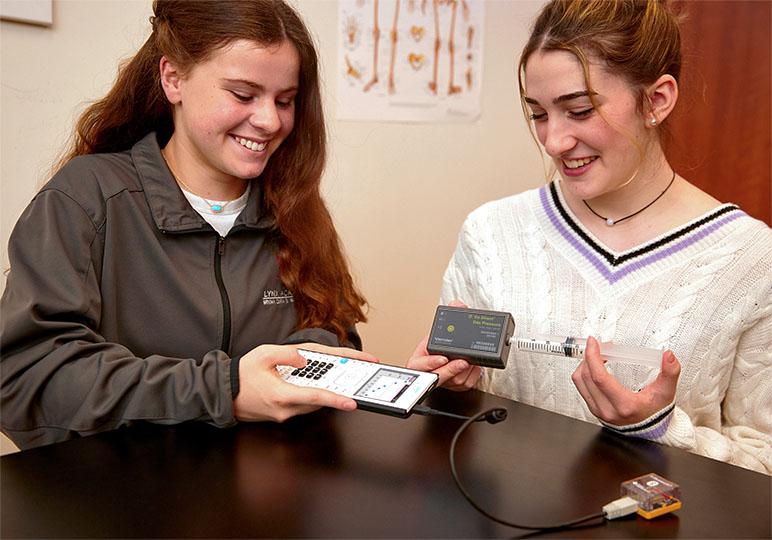
The Vernier DataQuest® app on the TI-Nspire CX II and TI-Nspire CX II CAS handheld calculators is now compatible with six Vernier Go Direct® sensors! This integration opens up new, more accessible opportunities for hands-on learning and real-time data analysis on two of Texas Instruments’ most popular graphing calculators.
What You Need to Get Started
TI-Nspire CX II Calculators
Using the DataQuest app on the TI-Nspire CX II and TI-Nspire CX II CAS calculators, students can predict, collect, and analyze data using tools such as interpolation, tangential rate, and modeling on their handheld calculators. Be sure your calculator’s operating system is up-to-date to fully support these new features.
Compatible Go Direct Sensors
These six wireless sensors enable students to collect real-time data both in the classroom and the field using time-based and event-based collection modes.
TI Bluetooth Adapter
Wirelessly connect up to four Go Direct sensors using the TI Bluetooth® Adapter. Make sure your adapter is updated with the latest firmware to support this updated compatibility.
How to Wirelessly Connect Sensors to the DataQuest App
You can connect any compatible Go Direct sensor to the TI-Nspire CX II graphing calculator via USB cable or Bluetooth® wireless technology. To connect wirelessly, follow these steps:
- Connect the TI Bluetooth® Adapter to your TI-Nspire CX II calculator via USB.
- Turn on the calculator and press the Home button. Navigate to the Vernier DataQuest app [icon] at the bottom right and select it to open.
- Press the power button on the Vernier Go Direct sensor. The LED will blink red.
- Choose New Experiment from the Experiment menu [icon].
- Select Add Bluetooth Sensor. A list of available sensors will appear on the screen.
- Locate your sensor in the list. If multiple sensors are listed, look for the one that matches the barcode on the label of your sensor.
- Select Connect. The LED light on your sensor will blink green.
- Adjust the sensor channel as needed for your experiment (not applicable to all sensors). Select OK to complete the connection.
The Vernier DataQuest app should now display live data in the meter. You can adjust collection mode and units as needed for your investigation.
Need additional details for connecting to your sensor? See our FAQ.
Hands-On Experiment Ideas Using These Tools
These experiments were originally published in Real-World Math with Vernier and can be easily adapted for use with compatible Go Direct sensors and TI-Nspire calculators.
1. Walk the Line
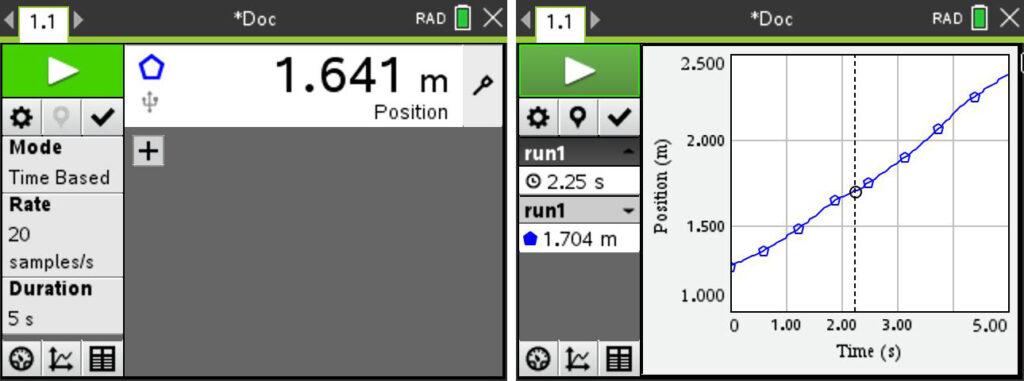
This experiment helps students understand how mathematical concepts like linear equations connect to real-world movement. Using the Go Direct Motion Detector, students can create straight-line position vs. time graphs, which represent constant speed. Then develop linear equations that describe these plots mathematically.
Objectives
- Record distance vs. time data for a person walking at a uniform rate.
- Analyze the data to extract slope and intercept information.
- Interpret the slope and intercept information for physical meaning.
2. Light at a Distance – Distance and Light Intensity
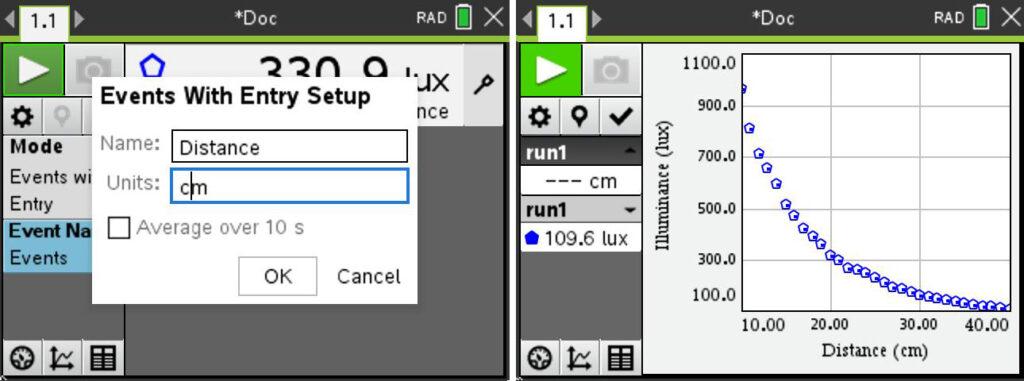
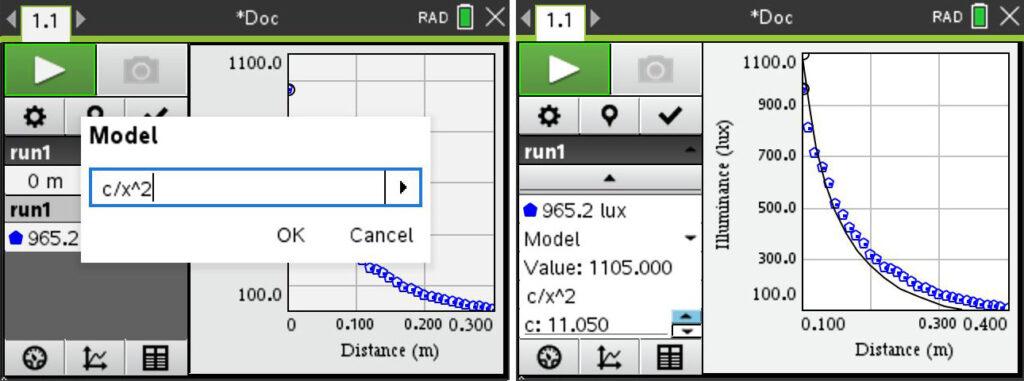
In this activity, students explore how light intensity changes with distance through the anchoring phenomena of observing vehicle headlights at night. By recording the light intensity of a bulb at various distances using the Go Direct Light and Color Sensor, they can model this data mathematically, investigating the relationship between distance and light intensity.
Objectives
- Collect light intensity vs. distance data for a point light source.
- Compare data to an inverse-square model.
- Compare data to a power law model.
- Discuss the difference between an inverse-square model and a power law model.
Webinar Recording: Connecting Go Direct Sensors and TI‑Nspire Technology

Want to see these tools in action? In this webinar, the TI and Vernier teams demonstrate how using Vernier sensors and TI calculators together can support hands-on student engagement in math and science! Presentation resources, including sample experiments, are available to download in the link.
Watch Now
Questions about connecting your Go Direct sensors with TI-Nspire technology? We’re here to help! Check out our FAQ and troubleshooting guide here. Our support team is also available to help—call 888-837-6437, reach out to support@vernier.com, or drop us a note in the live chat!
Share this Article

Sign up for our newsletter
Stay in the loop! Beyond Measure delivers monthly updates on the latest news, ideas, and STEM resources from Vernier.


