Sharing ideas and inspiration for engagement, inclusion, and excellence in STEM
Energy, acceleration, and simple harmonic motion are just a few important physics principles for students to learn—and using the Graphical Analysis Pro app with our Go Direct® sensors can help bring these abstract scientific concepts to life.
Some of the app’s features were inspired by my experience as a high school physics teacher. For example, I would have loved to have been able to do live data sharing and use FFTs with my students.
Graphical Analysis Pro also promotes accessibility, which is great for educators and students alike. The app works on a wide variety of devices and platforms, including Chromebooks™, cell phones, and iOS.
On August 1, we will be offering a free webinar that highlights ways to use the app’s advanced features with some of our most popular Go Direct physics sensors to explore force, motion, and sound.
Ahead of the webinar, I’m sharing three experiments that are great for hands-on physics learning. Although they do not specifically mention Graphical Analysis Pro, these experiments offer excellent opportunities to incorporate the app into your teaching.
“Energy of a Tossed Ball”
This experiment, which is from our Physics with Vernier lab book, involves the Go Direct Motion Detector. “Energy of a Tossed Ball” also gives students a chance to use the user-defined calculated columns feature in Graphical Analysis Pro.
Specifically, students can explore advanced curve fits using custom calculations; they simply create an energy column that looks like the energy equation used in class.

“Energy of a Tossed Ball” also gives students an opportunity to use the data-sharing feature in Graphical Analysis Pro. For instance, you can do an in-person demonstration of a ball toss and then share the measured motion data with your class. Afterward, each student can use the shared data, in combination with Graphical Analysis Pro, to individually calculate the kinetic and gravitational potential energy.
The objectives of the experiment include
- Measure the change in the kinetic and potential energies as a ball moves in free fall.
- See how the total energy of the ball changes during free fall.
“Simple Harmonic Motion: Kinematics and Dynamics”
Want to introduce students to the user-defined curve fits feature in Graphical Analysis Pro?
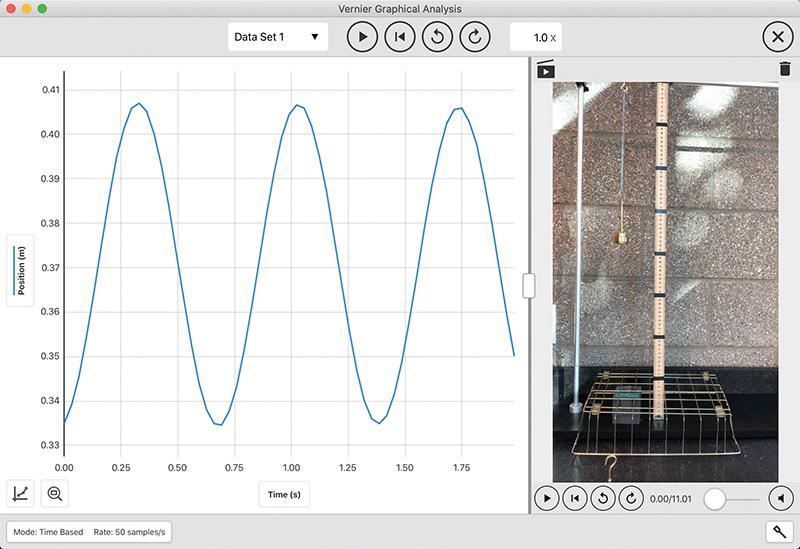
“Simple Harmonic Motion: Kinematics and Dynamics” (which is from our Advanced Physics with Vernier—Mechanics lab book) is an excellent option. Students will create a custom curve fit for the velocity vs. time graph based on parameters from the position vs. time graph.
Like “Energy of a Tossed Ball,” this experiment can use the Go Direct Motion Detector. The objectives include
- Collect position vs. time data as a weight, hanging from a spring, is set in simple harmonic motion.
- Determine the best-fit equation for the position vs. time graph of an object undergoing simple harmonic motion.
- Define the terms amplitude, offset, phase shift, period, and angular frequency in the context of simple harmonic motion.
- Predict characteristics of the corresponding velocity vs. time and acceleration vs. time graphs, produce these graphs, and determine best-fit equations for them.
- Relate the net force and acceleration for a system undergoing simple harmonic motion.
“Error Analysis”
You can easily incorporate advanced graph types available in Graphical Analysis Pro (i.e., histograms) into this experiment (which can also be found in our Advanced Physics with Vernier—Mechanics lab book). “Error Analysis” also gives students a chance to understand variations in experimentally determined data.
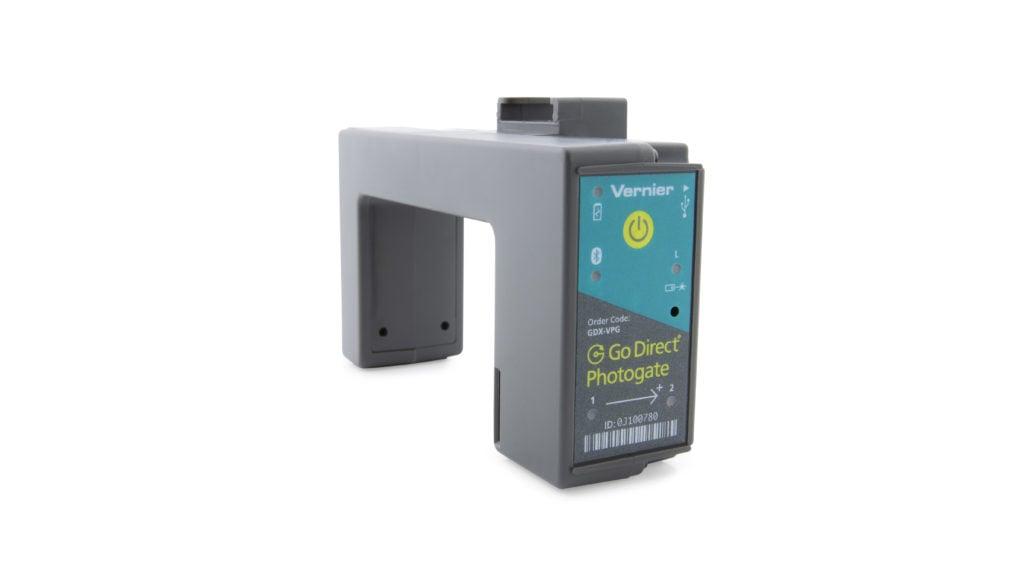
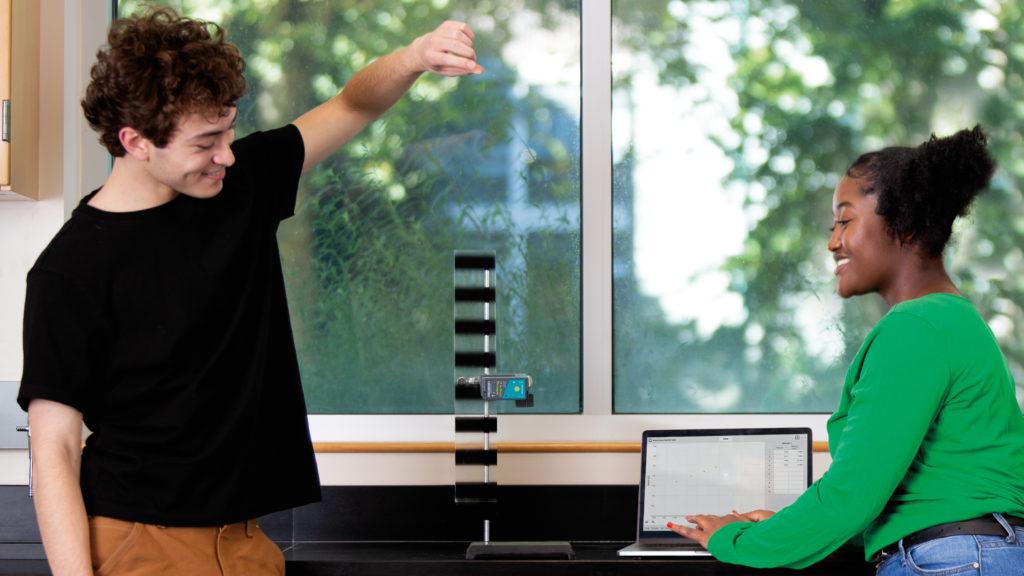
In this experiment, students use the Go Direct Photogate to
- Determine the value of the acceleration of a freely falling object.
- Compare their value with the accepted value for this quantity.
- Learn how to describe and account for variation in a set of measurements.
- Learn how to describe a range of experimental values.
Want to explore more ways that Graphical Analysis Pro can elevate hands-on physics learning? We’re here to help! Just contact us at physics@vernier.com or 888-837-6437.
Share this Article
Related Articles


Sign up for our newsletter
Stay in the loop! Beyond Measure delivers monthly updates on the latest news, ideas, and STEM resources from Vernier.